Fig. 6
Download original image
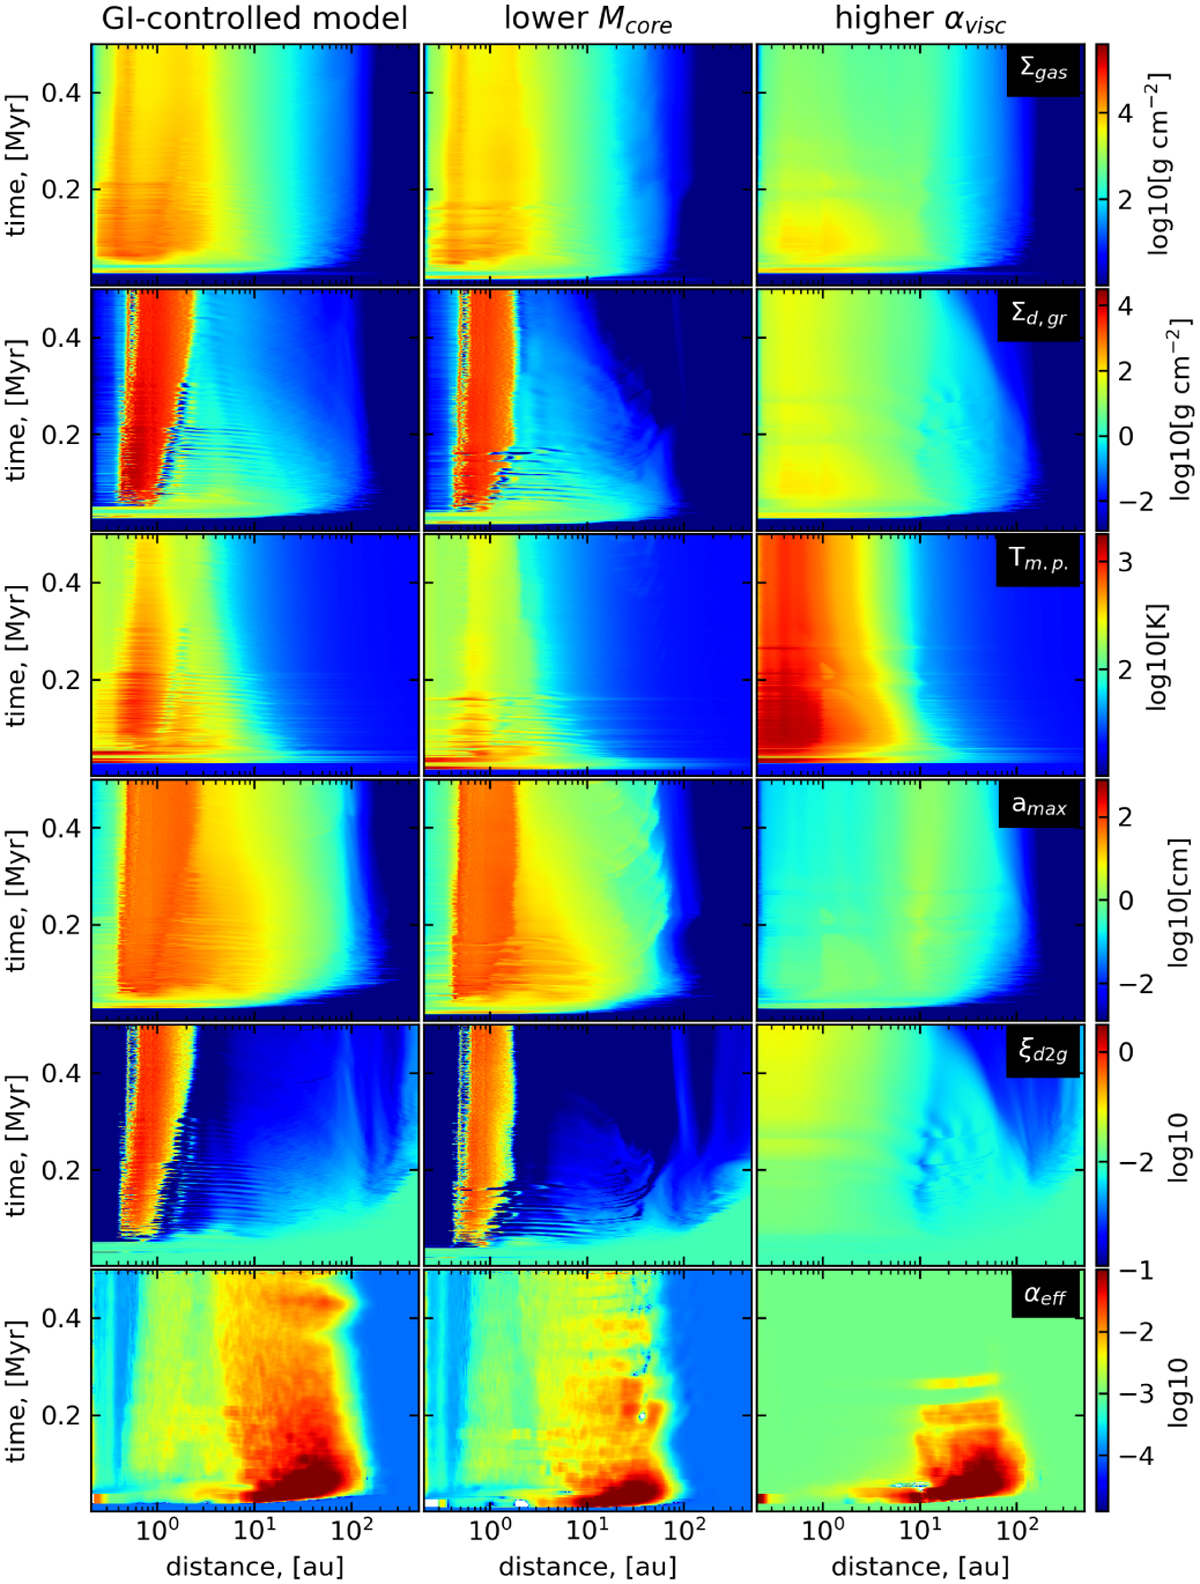
Space-time plots showing the time-evolution of the azimuthally averaged disk characteristics. The columns from left to right correspond to the fiducial model with Mcore = 0.53 M⊙ and αvisc = 10−4, the model with a lower Mcore = 0.3 M⊙, and the model with higher αvisc = 10−3. The rows from top to bottom show: the gas surface density, grown dust surface density, gas temperature in the disk’s midplane, maximum dust size, total dust-to-gas mass ratio, and the effective α-parameter.
Current usage metrics show cumulative count of Article Views (full-text article views including HTML views, PDF and ePub downloads, according to the available data) and Abstracts Views on Vision4Press platform.
Data correspond to usage on the plateform after 2015. The current usage metrics is available 48-96 hours after online publication and is updated daily on week days.
Initial download of the metrics may take a while.