Fig. 4
Download original image
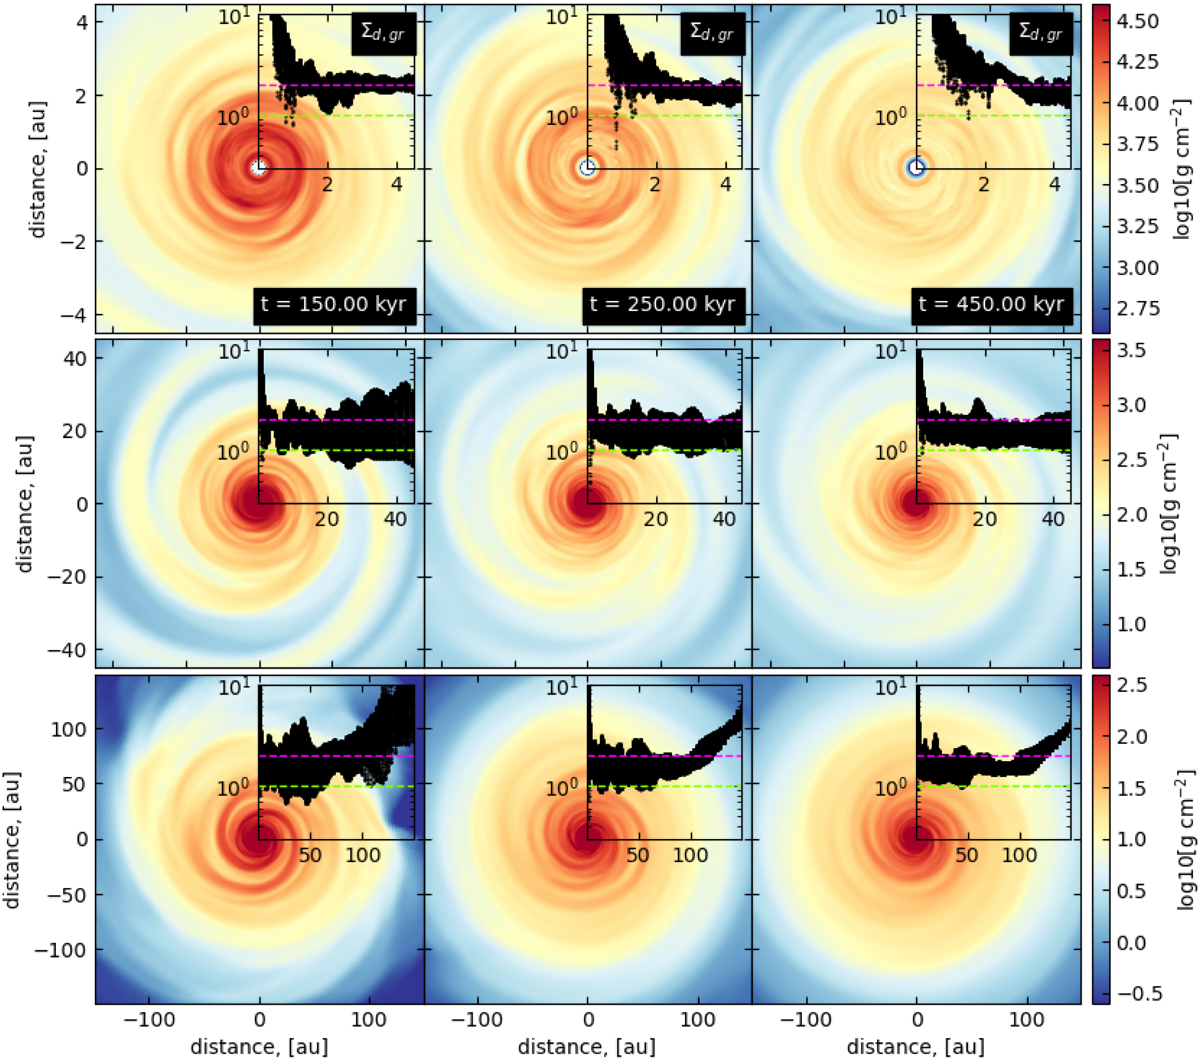
Gas surface density in the GI-controlled model shown at different spatial scales and evolution times. The panels from top to bottom capture an increasingly larger spatial region, while the columns from left to right present show the disk of a progressively older age. The insets in each of the panels display the Toomre Q-parameter as a function of radial distance. The dashed pink and green lines correspond to Q = 2 and Q = 1 for convenience.
Current usage metrics show cumulative count of Article Views (full-text article views including HTML views, PDF and ePub downloads, according to the available data) and Abstracts Views on Vision4Press platform.
Data correspond to usage on the plateform after 2015. The current usage metrics is available 48-96 hours after online publication and is updated daily on week days.
Initial download of the metrics may take a while.