Fig. A.1
Download original image
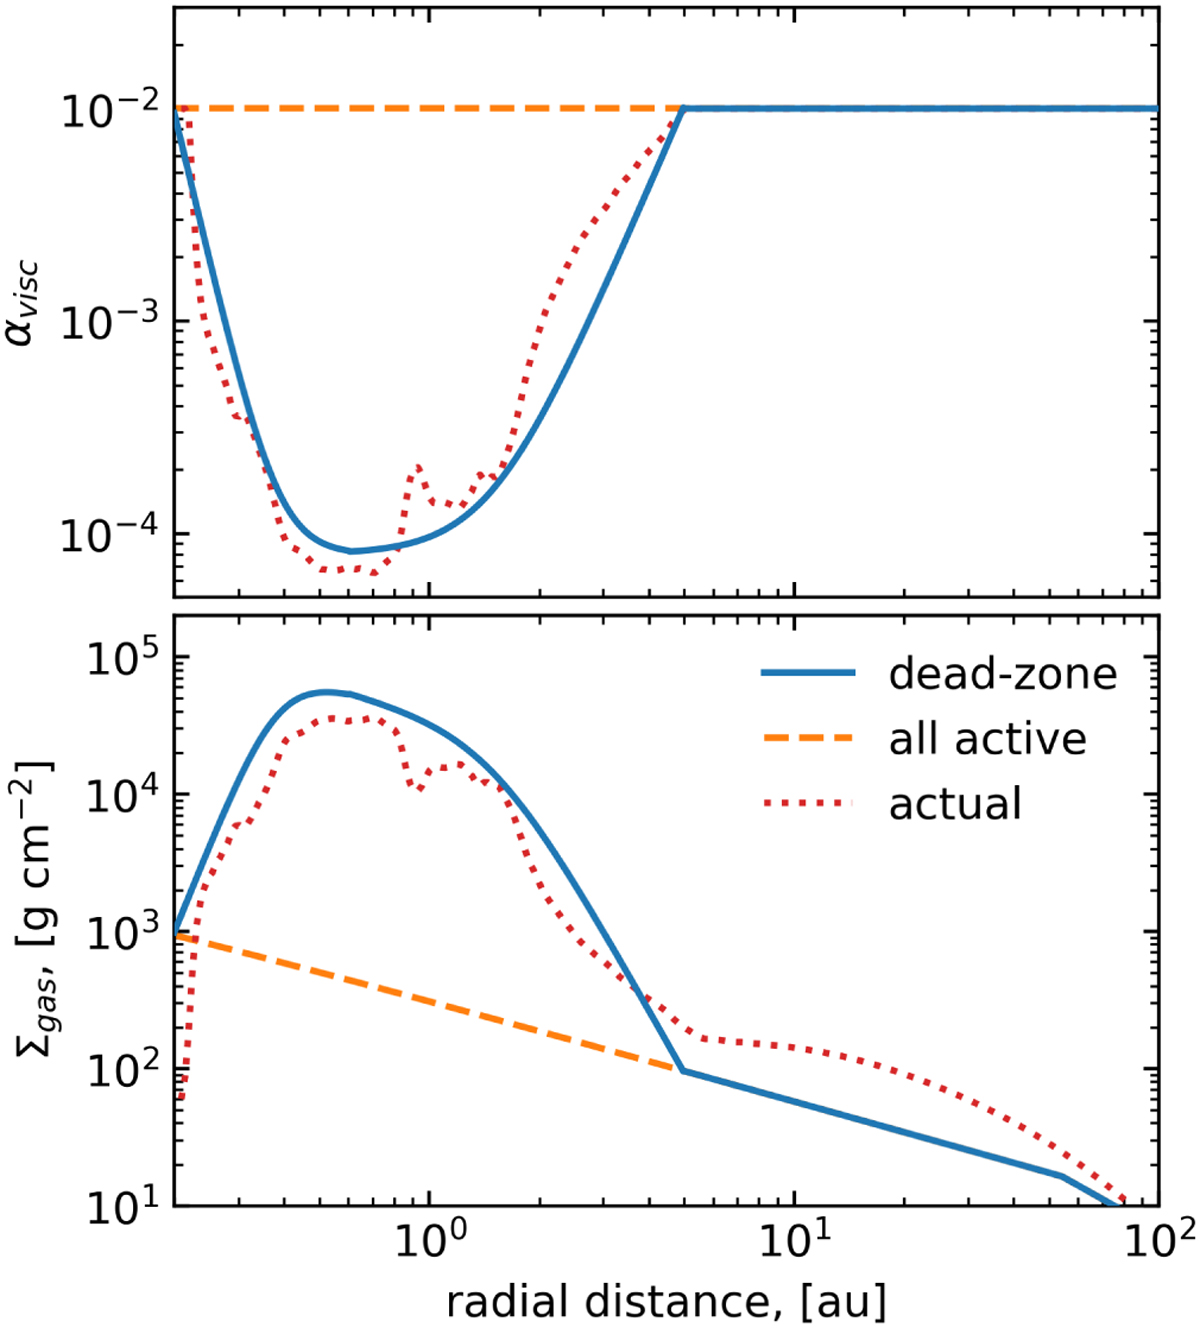
Gas surface density and αvisc radial profiles. Top: Red dotted and blue solid lines show the actual and fitted αvisc values in the layered disk model with a dead zone, while the orange dashed line corresponds to an MRI-active disk with a constant αvisc. Bottom: Corresponding radial profiles of the gas surface density obtained from the actual hydro-dynamic simulation (red dotted line), from solution of the steady-state Eq. (A.1) with radially varying αvisc (blue solid line), and from Eq. (A.1) with a spatially constant αvisc (orange dashed line).
Current usage metrics show cumulative count of Article Views (full-text article views including HTML views, PDF and ePub downloads, according to the available data) and Abstracts Views on Vision4Press platform.
Data correspond to usage on the plateform after 2015. The current usage metrics is available 48-96 hours after online publication and is updated daily on week days.
Initial download of the metrics may take a while.