Fig. 10
Download original image
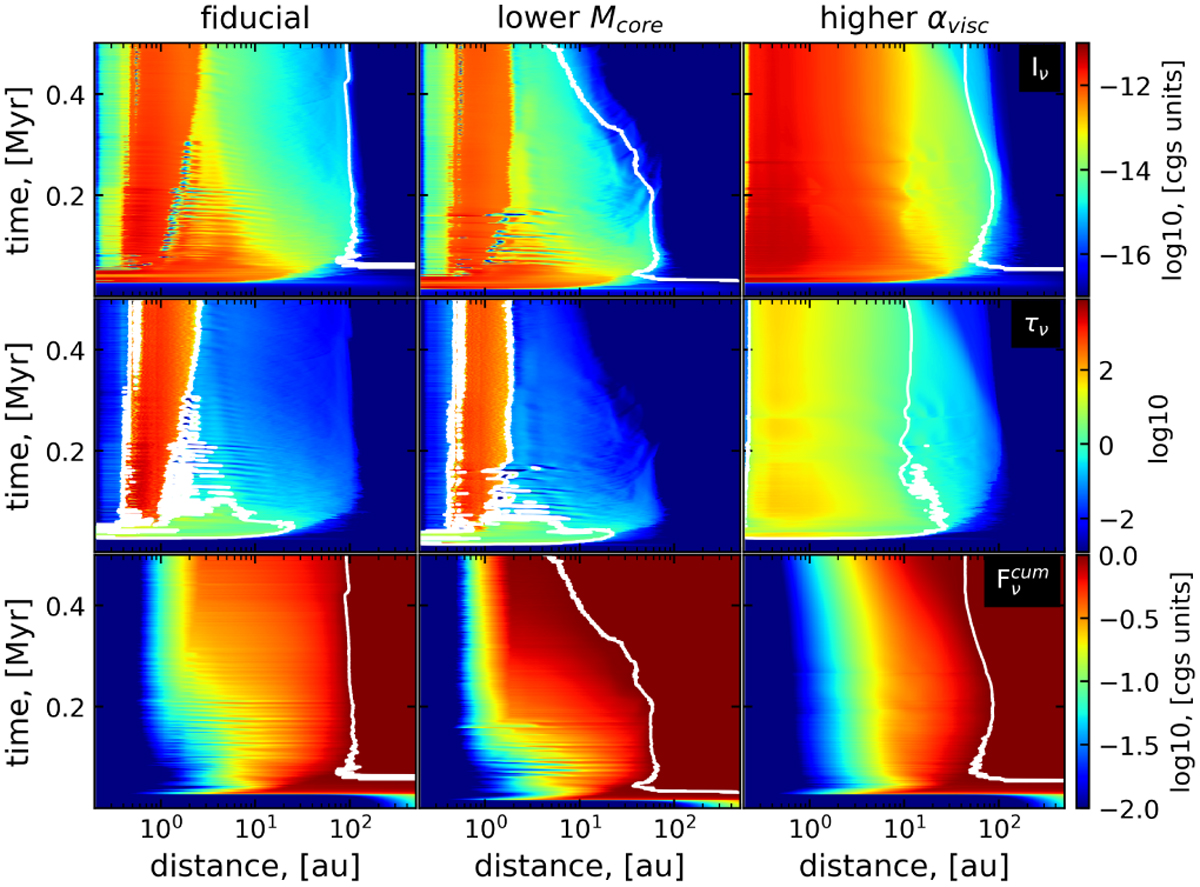
Space-time plots showing the evolution of dust radiation intensity (top row), optical depth (middle row), and cumulative flux (bottom panel) at 3 mm. Columns from left to right correspond to the fiducial model, model with a lower Mcore, and model with higher αvisc. The white contours in the top and bottom rows delineate the radial locations, within which 95% of the total flux is contained. The white curves in the middple row highlight the regions with the optical depth >1.0. The units for radiation intensity and flux are erg cm−2 s−1 Hz−1 sr−1 and erg cm−2 s−1 Hz−1, respectively.
Current usage metrics show cumulative count of Article Views (full-text article views including HTML views, PDF and ePub downloads, according to the available data) and Abstracts Views on Vision4Press platform.
Data correspond to usage on the plateform after 2015. The current usage metrics is available 48-96 hours after online publication and is updated daily on week days.
Initial download of the metrics may take a while.