Fig. 1
Download original image
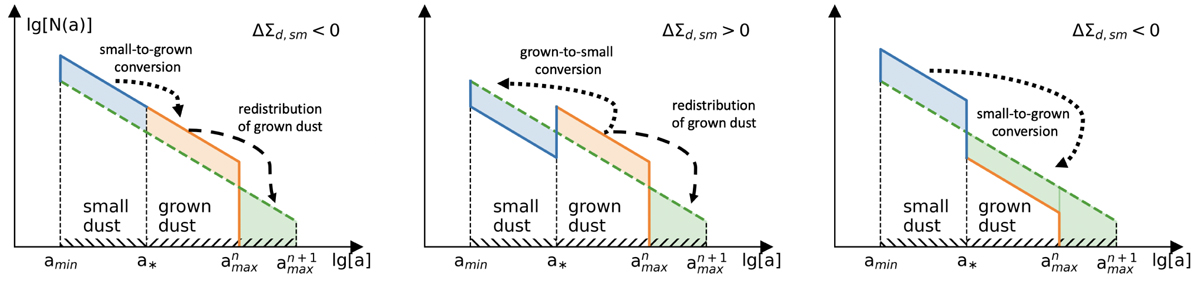
Graphical representation of the conversion between grown and small dust shown for the case of ![]() The solid blue and orange lines indicate the dust distribution at the current time step n. The next time step n + 1 is denoted by the green dashed line. Three cases are presented in the three panels from left to right: (i) the case with a continuous distribution at a⋆ ; (ii) discontinuous distribution with a dominance of grown dust turning into a continuous distribution, (iii) redistribution of the excess of small dust to provide a continuous distribution.
The solid blue and orange lines indicate the dust distribution at the current time step n. The next time step n + 1 is denoted by the green dashed line. Three cases are presented in the three panels from left to right: (i) the case with a continuous distribution at a⋆ ; (ii) discontinuous distribution with a dominance of grown dust turning into a continuous distribution, (iii) redistribution of the excess of small dust to provide a continuous distribution.
Current usage metrics show cumulative count of Article Views (full-text article views including HTML views, PDF and ePub downloads, according to the available data) and Abstracts Views on Vision4Press platform.
Data correspond to usage on the plateform after 2015. The current usage metrics is available 48-96 hours after online publication and is updated daily on week days.
Initial download of the metrics may take a while.