Fig. 7.
Download original image
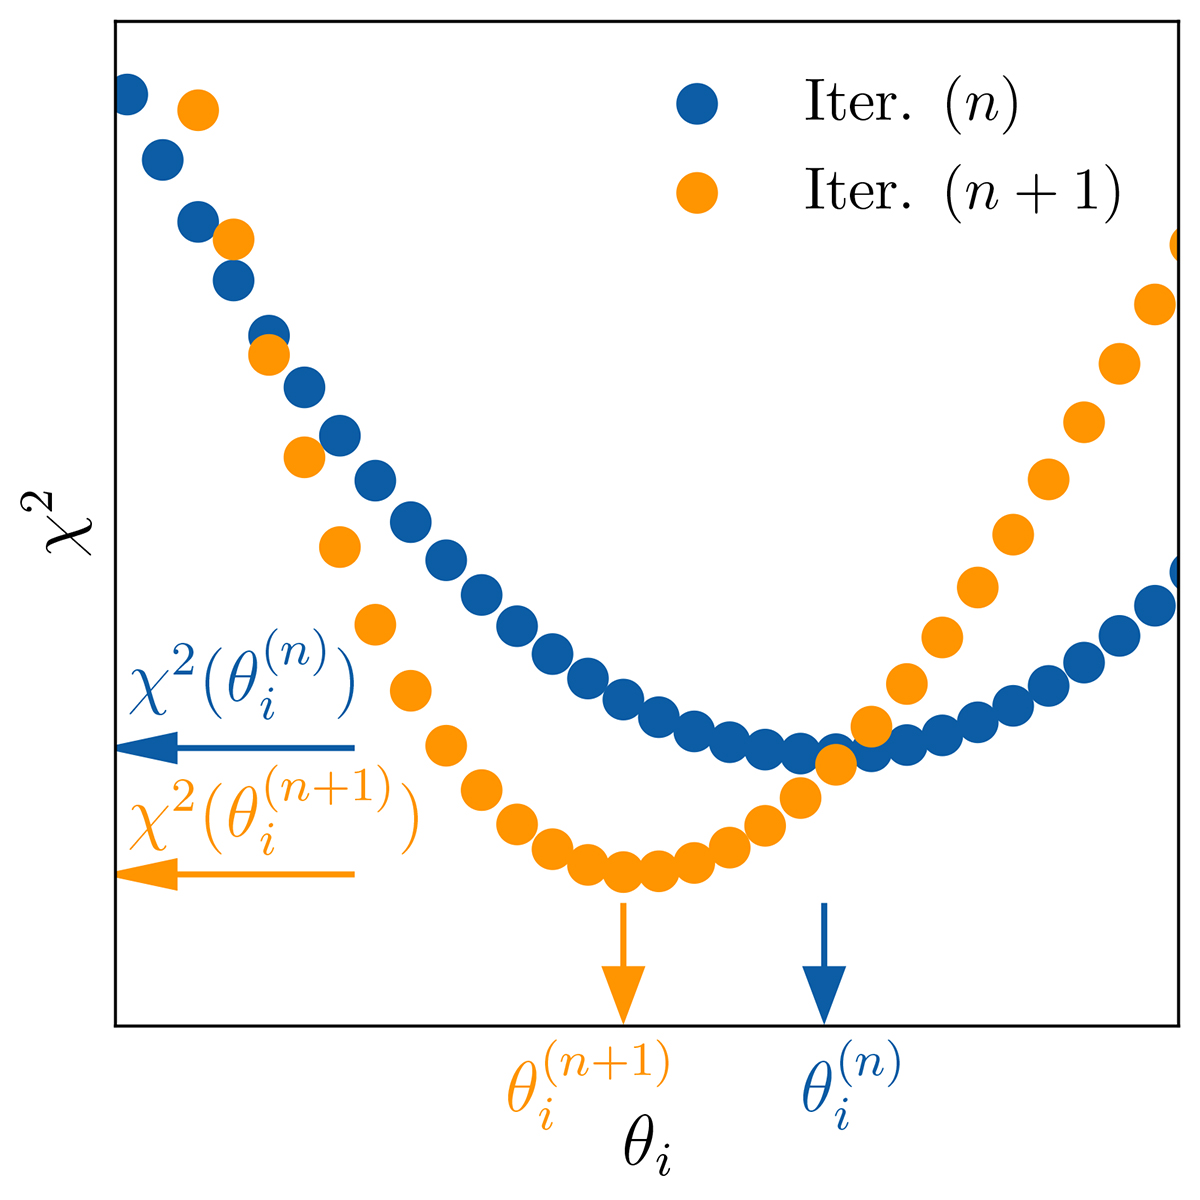
Sketch of a variation of χ2 statistics as a function of parameter θi for an iteration step (n) in blue and (n + 1) in orange. The points demonstrate the grid points in θi, with a grid step size of Δθi, where the χ2 is computed. The coloured arrows highlight the value of the parameter at the minimum of the χ2 statistics on the x axis and the absolute value of the statistics on the y axis.
Current usage metrics show cumulative count of Article Views (full-text article views including HTML views, PDF and ePub downloads, according to the available data) and Abstracts Views on Vision4Press platform.
Data correspond to usage on the plateform after 2015. The current usage metrics is available 48-96 hours after online publication and is updated daily on week days.
Initial download of the metrics may take a while.