Fig. D.1.
Download original image
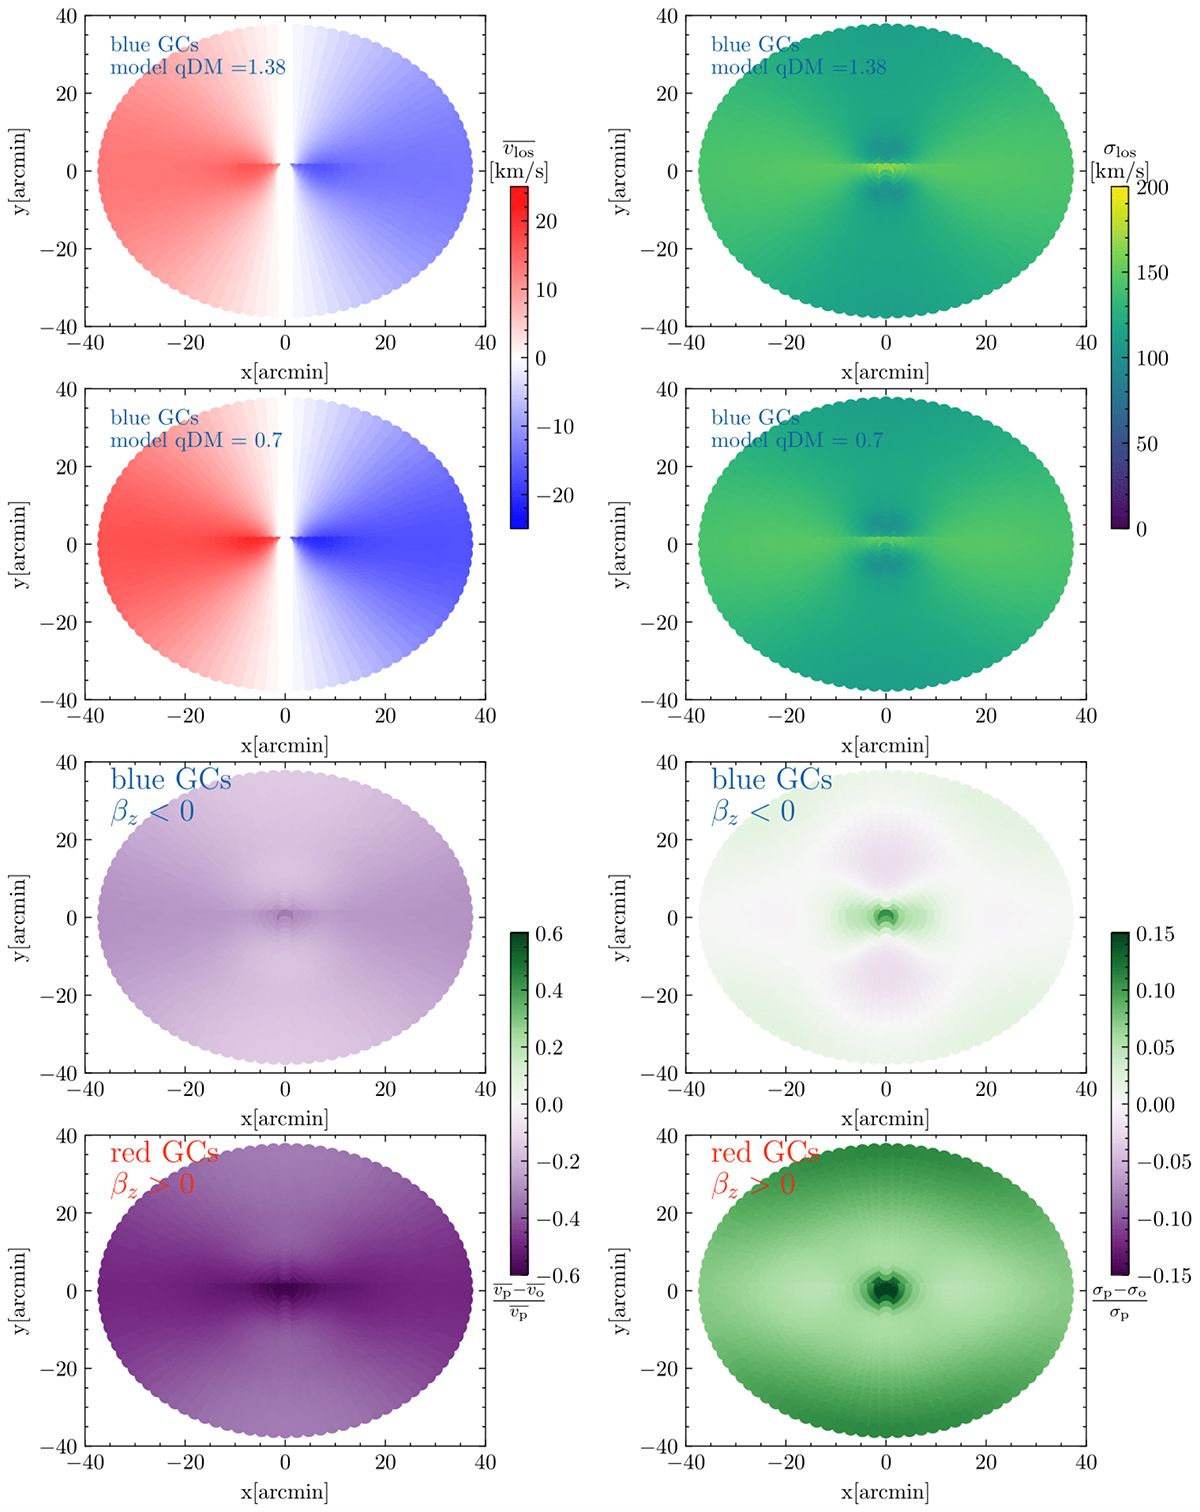
Comparison between the first and second moment velocity maps for axisymmetric Jeans modelling in the left and right column, respectively. The first two rows show the best-fit models for blue GCs, with the best fit qDM = 1.38 in the top qDM = 0.7 below. The bottom two rows show the residuals for the blue GCs on the top and red GCs on the bottom. The parameters used to evaluate the model were taken from Table 6 and for qDM = 0.7 we take the other parameters at the minimal χ2 based on the 2D χ2 grids as shown in Fig. 9.
Current usage metrics show cumulative count of Article Views (full-text article views including HTML views, PDF and ePub downloads, according to the available data) and Abstracts Views on Vision4Press platform.
Data correspond to usage on the plateform after 2015. The current usage metrics is available 48-96 hours after online publication and is updated daily on week days.
Initial download of the metrics may take a while.