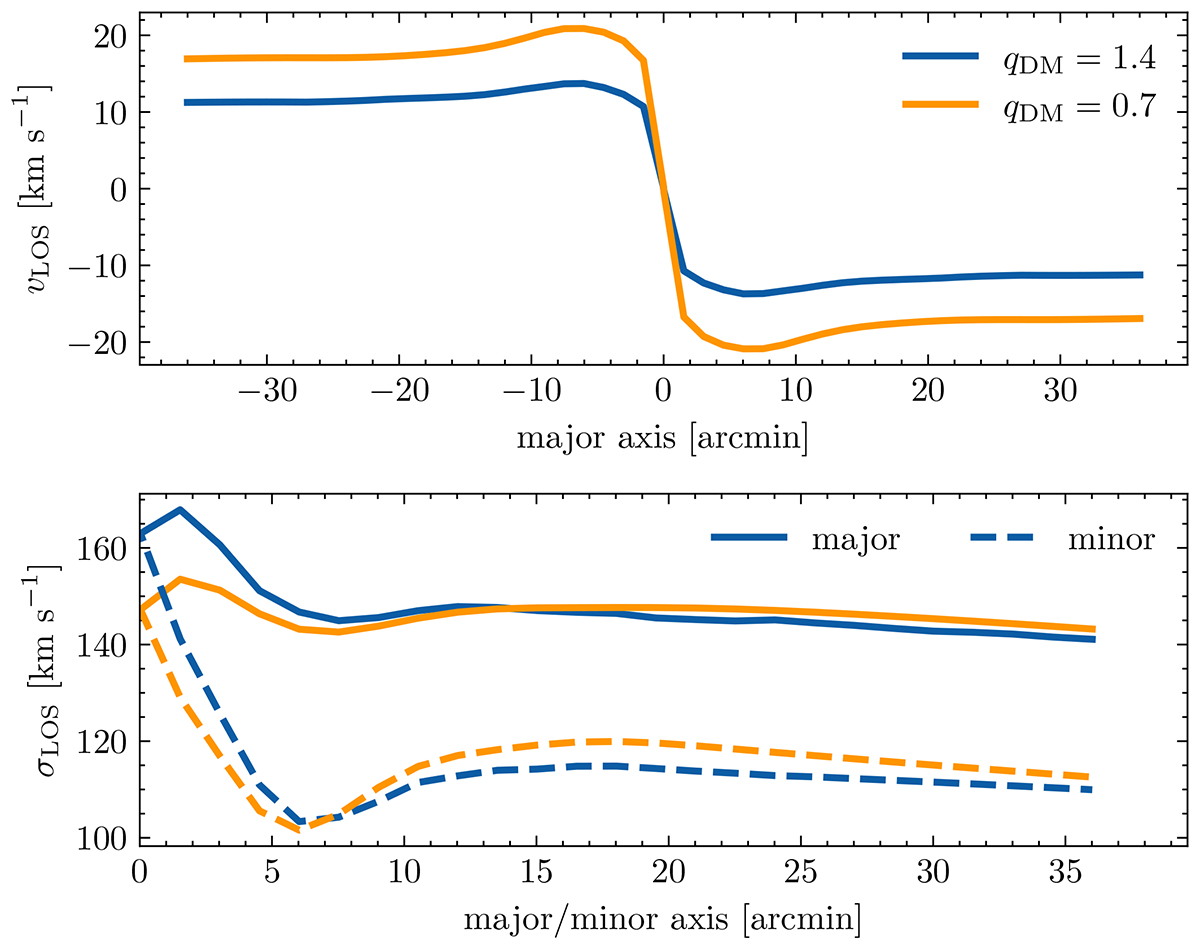
Fig. 13.
Download original image
Comparing best-fit prolate (blue) and oblate (orange) CJAM model results. The top panel shows the mean LOS velocity along the major axis. The bottom panel shows the velocity dispersion along the major axis as solid lines and along the minor axis as dashed lines. The LOS velocity is shown symmetrically along the major and minor axes, to highlight the asymmetric rotational signature. However, the velocity dispersion on the bottom panel is shown for positive values of the axes due to the symmetry of σLOS.
Current usage metrics show cumulative count of Article Views (full-text article views including HTML views, PDF and ePub downloads, according to the available data) and Abstracts Views on Vision4Press platform.
Data correspond to usage on the plateform after 2015. The current usage metrics is available 48-96 hours after online publication and is updated daily on week days.
Initial download of the metrics may take a while.