Fig. 7
Download original image
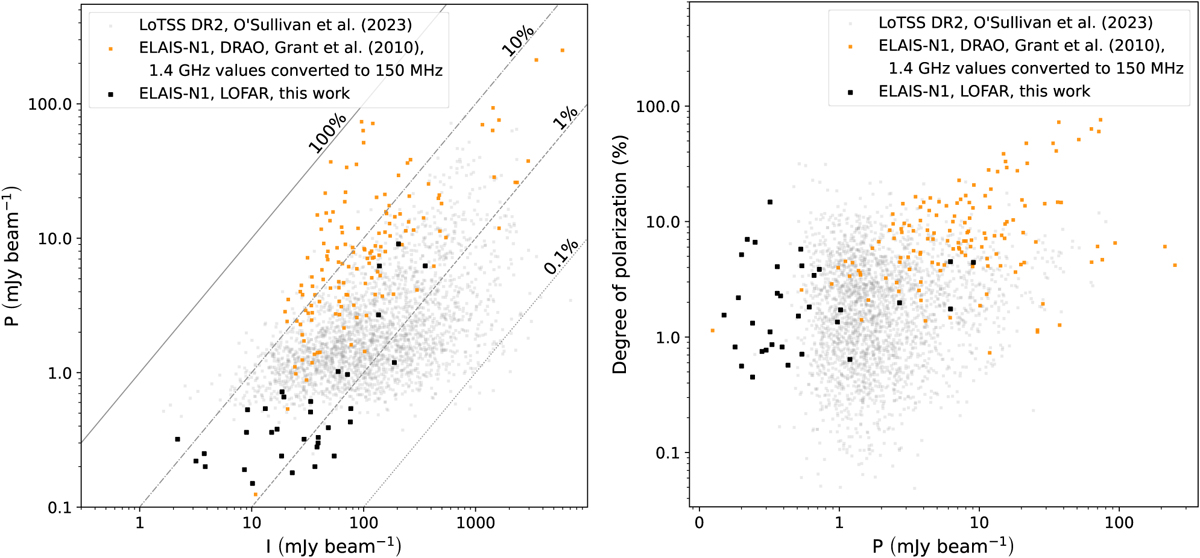
Peak polarized intensity vs. total intensity (left panel) and degree of polarization vs. peak polarized intensity (right panel) for three catalogs: in gray the LoTSS-DR2 RM grid catalog of O’Sullivan et al. (2023); in black the polarized sources in ELAIS-N1 at 150 MHz (this work); in orange the values for sources in the DRAO ELAIS-N1 catalog, where both I and P have been converted from 1.4 GHz to 150 MHz using the spectral indices given by Grant et al. (2010). The diagonal lines correspond to the indicated degrees of polarization.
Current usage metrics show cumulative count of Article Views (full-text article views including HTML views, PDF and ePub downloads, according to the available data) and Abstracts Views on Vision4Press platform.
Data correspond to usage on the plateform after 2015. The current usage metrics is available 48-96 hours after online publication and is updated daily on week days.
Initial download of the metrics may take a while.