Open Access
Fig. 5
Download original image
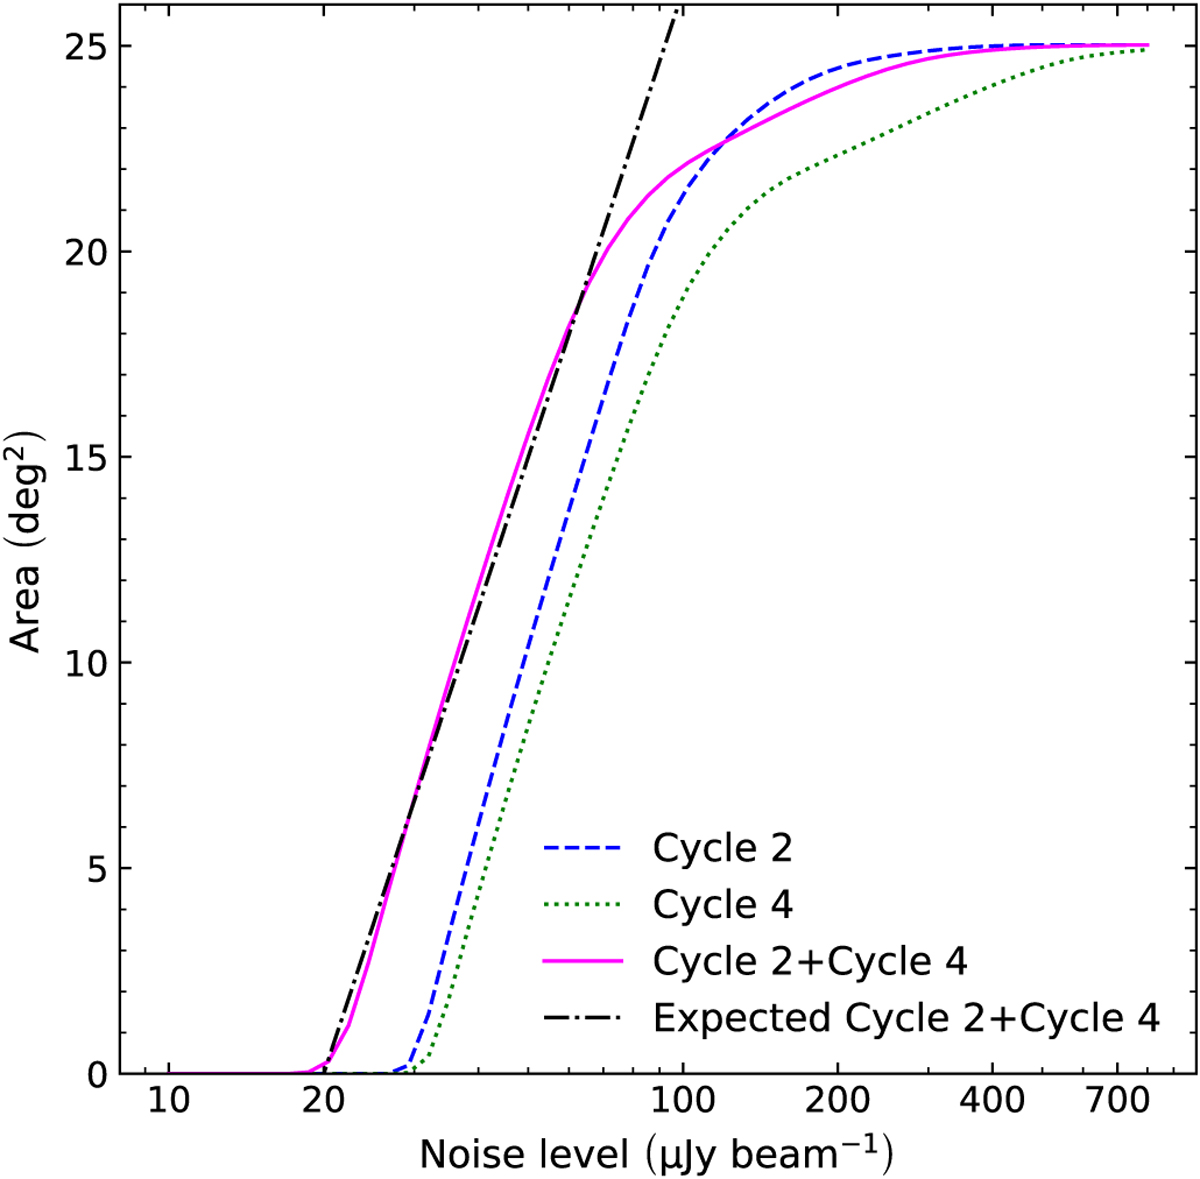
Area of the field with noise σQU equal to or lower than a given value in data from stacked individual cycles and in the final dataset. The black dashed curve is the expected profile from a Gaussian primary beam (Eq. (15)), with σ0 = 20 µJy beam−1.
Current usage metrics show cumulative count of Article Views (full-text article views including HTML views, PDF and ePub downloads, according to the available data) and Abstracts Views on Vision4Press platform.
Data correspond to usage on the plateform after 2015. The current usage metrics is available 48-96 hours after online publication and is updated daily on week days.
Initial download of the metrics may take a while.