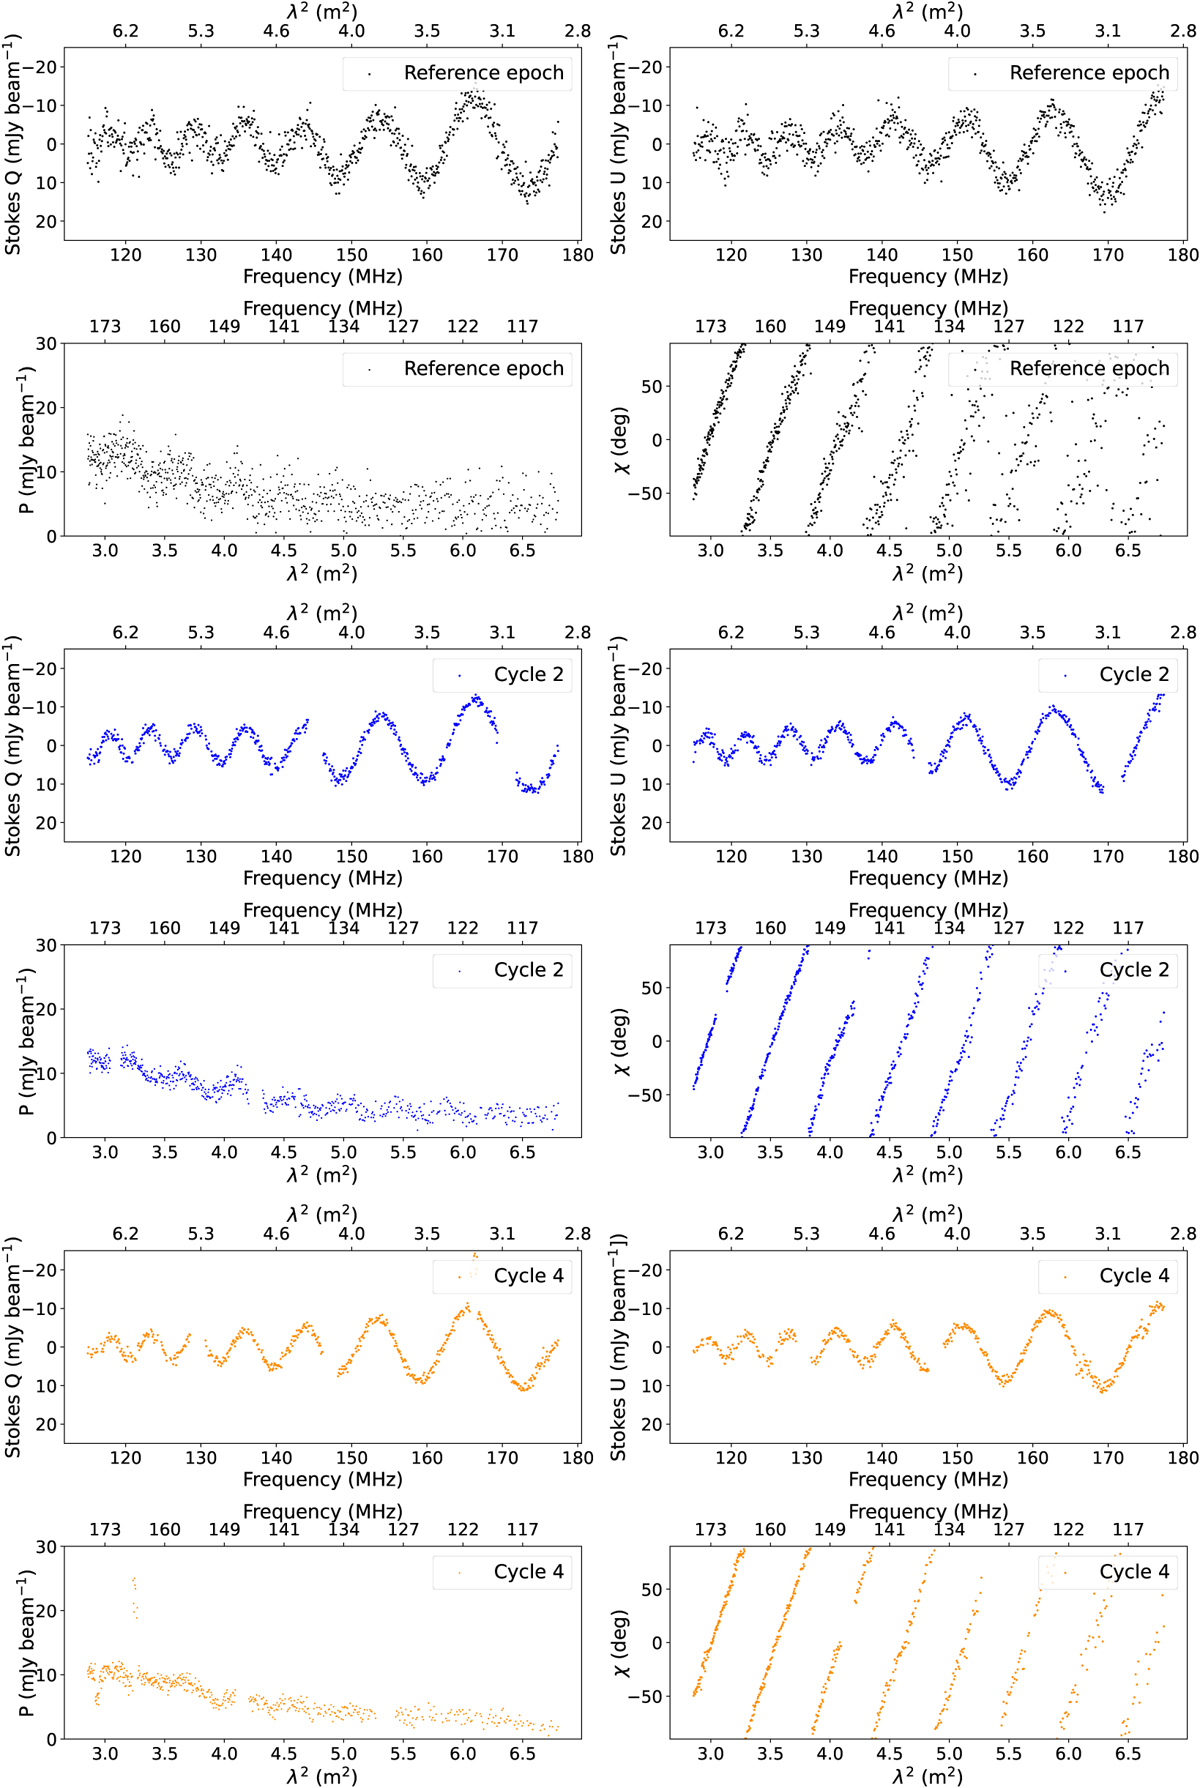
Fig. 3
Download original image
Polarization characteristics of the reference source (Source 07). Stokes Q and U intensities, polarized intensity P and polarization angle χ are shown as a function of frequency and wavelength squared λ2 (bottom and top axes) for the reference epoch (in black, first two rows), and for the stacked data from Cycle 2, (in blue, third and fourth row) and from Cycle 4 (in orange, two last rows). The scatter in the data is reduced by stacking. The effect of Faraday rotation is clearly visible in the variations of Q, U and χ; the decrease of the polarized intensity with λ2 is an indication of Faraday depolarization. The final combination of Cycle 2 and Cycle 4 data is done in Faraday depth space, as described in the text.
Current usage metrics show cumulative count of Article Views (full-text article views including HTML views, PDF and ePub downloads, according to the available data) and Abstracts Views on Vision4Press platform.
Data correspond to usage on the plateform after 2015. The current usage metrics is available 48-96 hours after online publication and is updated daily on week days.
Initial download of the metrics may take a while.