Fig. 1.

Download original image
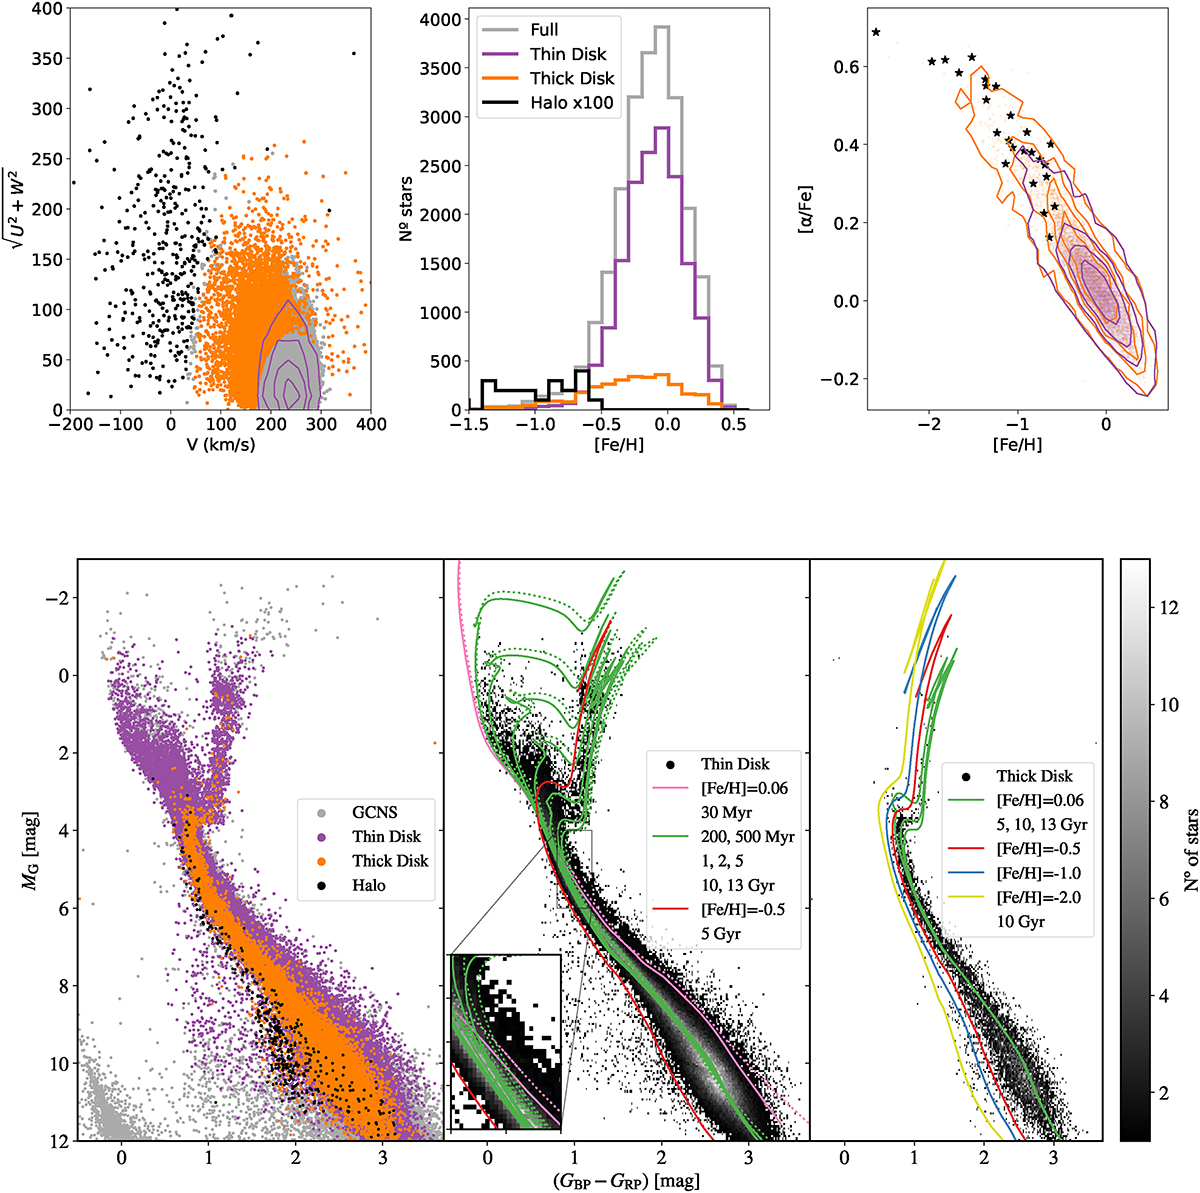
Summary of the content of the updated GCNS. Upper left panel: Toomre diagram of the stars with line-of-sight velocities. The thin disc stellar distribution is represented with violet contours and the thick disc and halo stars as orange and black dots, respectively. The grey points in the background represent the whole GCNS sample with kinematic data from DR3. Middle upper panel: [Fe/H] distribution for the global (grey), thin disc (purple), thick disc (orange), and halo (black; multiplied by 100). Upper right panel: [α/Fe] distribution of halo stars (black stars), thick disc stars (orange dots and contours), and thin disc stars (purple dots and contours). In these two panels only those stars with abundance information are represented. Lower left panel: CMD of the three kinematically selected components within 100 pc of the Sun, superimposed to the whole original GCNS sample (in grey): thin disc (purple), thick disc (orange), and halo (black). Middle panel: CMD of the kinematic thin disc with superimposed isochrones of solar metallicity with a range of ages (0.03, 0.2, 0.5, 1, 2, 5, 10, and 13 Gyr) from the BaSTI-IAC (solid lines) and PARSEC (Bressan et al. 2012, dashed lines) stellar evolution libraries. A [M/H] = −0.5, 5 Gyr old metallicity BaSTI isochrone is also plot. Lower right panel: CMD of the kinematic thick disc with superimposed isochrones from the BaSTI-IAC library: [Fe/H] = 0.06 and 5, 10, and 13 Gyr; [Fe/H] = −0.5, −1.0, −2.0, and 10 Gyr.
Current usage metrics show cumulative count of Article Views (full-text article views including HTML views, PDF and ePub downloads, according to the available data) and Abstracts Views on Vision4Press platform.
Data correspond to usage on the plateform after 2015. The current usage metrics is available 48-96 hours after online publication and is updated daily on week days.
Initial download of the metrics may take a while.


