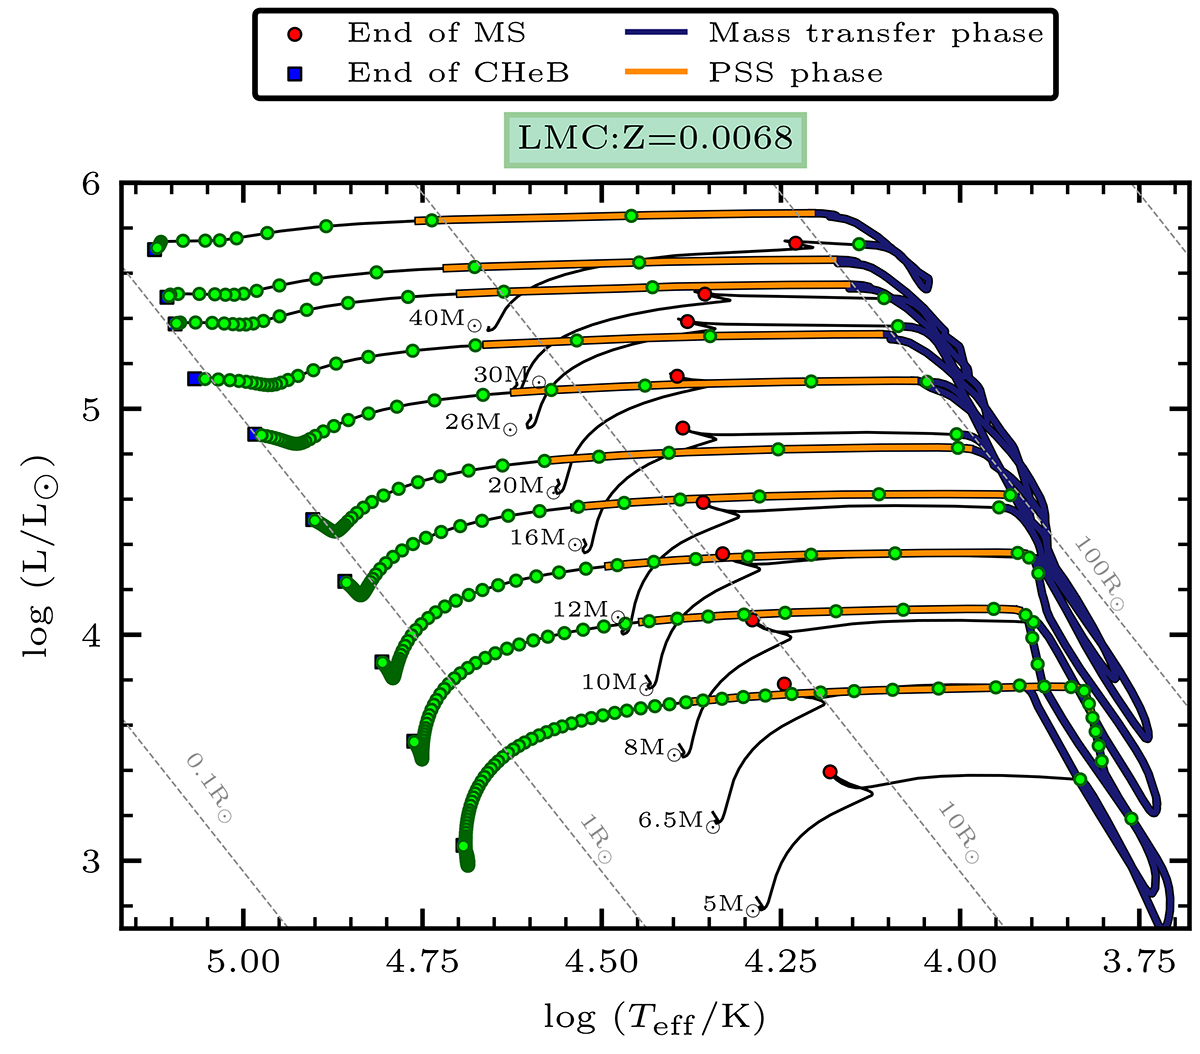
Fig. 6.
Download original image
Hertzsprung–Russel Diagram showing evolutionary tracks of the primary star in a binary system with initial masses 5, 6.5, 8, 10, 12, 16. 16.9, 20, 22, 26, 30 and 40 M⊙ at LMC metallicity. The blue lines represent the mass transfer phase, and the orange lines represent the puffed-up stripped star (PSS) phase. Red dots represent the terminal age main sequence (TAMS), and the blue squares represent the end of core Helium burning. The green dots are placed at intervals of 20 000 years starting from RLOF. The clustering of these dots towards the left shows that the star spends a long time in this phase.
Current usage metrics show cumulative count of Article Views (full-text article views including HTML views, PDF and ePub downloads, according to the available data) and Abstracts Views on Vision4Press platform.
Data correspond to usage on the plateform after 2015. The current usage metrics is available 48-96 hours after online publication and is updated daily on week days.
Initial download of the metrics may take a while.