Fig. 2.
Download original image
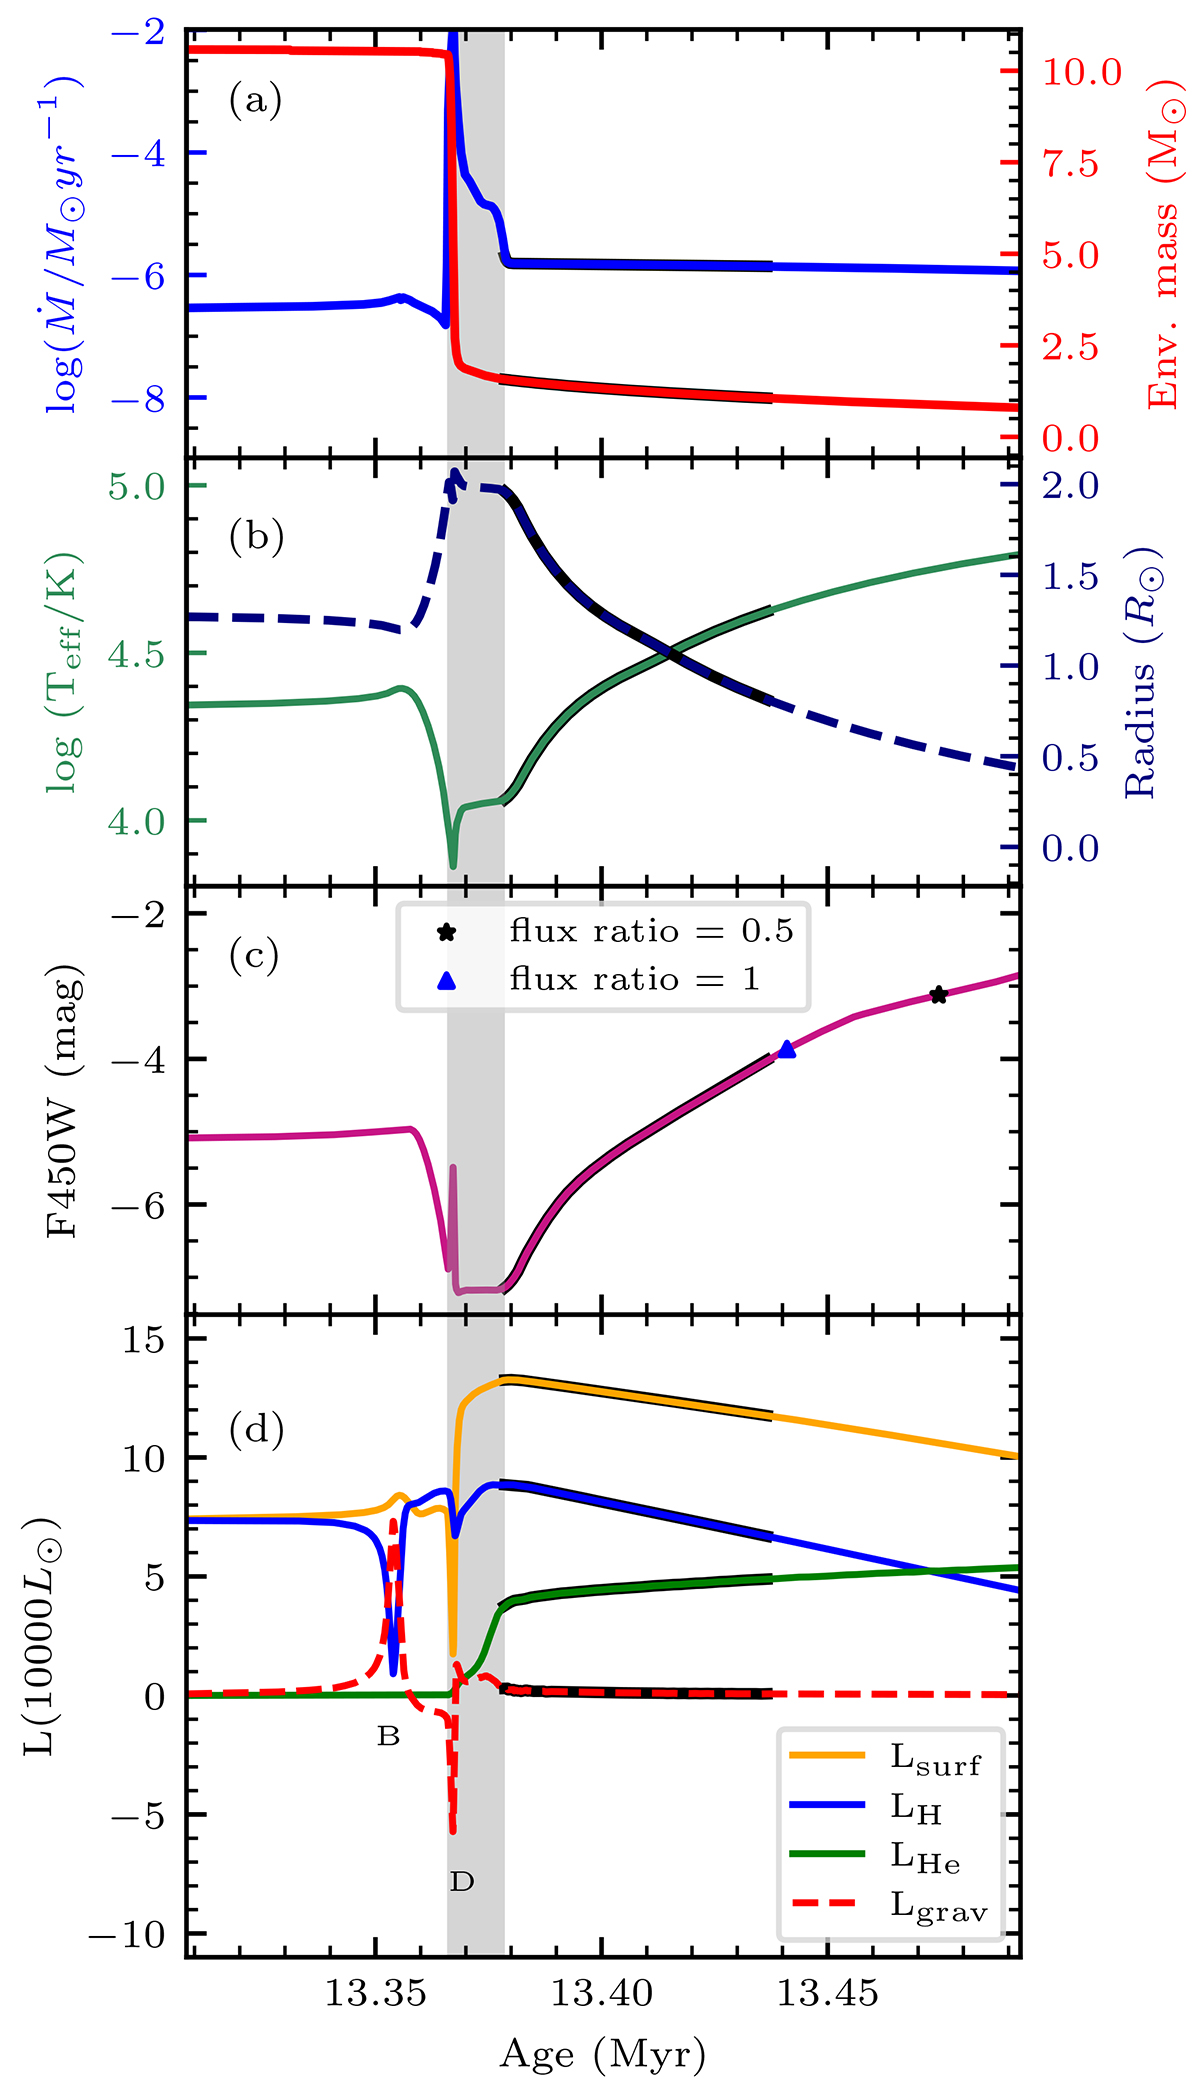
Evolution of various quantities of a 16 M⊙ model (at LMC metallicity) with star age, near the mass transfer phase leading up to the puffed-up stripped star (PSS) phase. Panel (a) shows the variation of envelope mass and mass loss rate of the donor. The mass loss is mainly due to the transfer of mass to the companion but also contains contribution from winds. Panel (b) shows the effective temperature (green) and donor radius (blue), and panel (c) shows the magnitude computed in the F450W optical filter of the HST WFPC2 camera. The blue triangle and the black star represent the position where the flux ratio (fstripped/fcompanion) drops below 1 and 0.5, respectively. Panel (d) represents various luminosities contributing to the total energy output: the orange line represents the surface luminosity (Lsurf), the blue and green lines represent the luminosity to hydrogen burning (LH) and helium burning (LHe) respectively. The luminosity in the red dashed line is the luminosity due to gravitational contraction/expansion (Lgrav). The grey-shaded region represents the mass transfer phase, and the regions with dark lines represent the puffed-up stripped star (PSS) phase.
Current usage metrics show cumulative count of Article Views (full-text article views including HTML views, PDF and ePub downloads, according to the available data) and Abstracts Views on Vision4Press platform.
Data correspond to usage on the plateform after 2015. The current usage metrics is available 48-96 hours after online publication and is updated daily on week days.
Initial download of the metrics may take a while.