Fig. 1.
Download original image
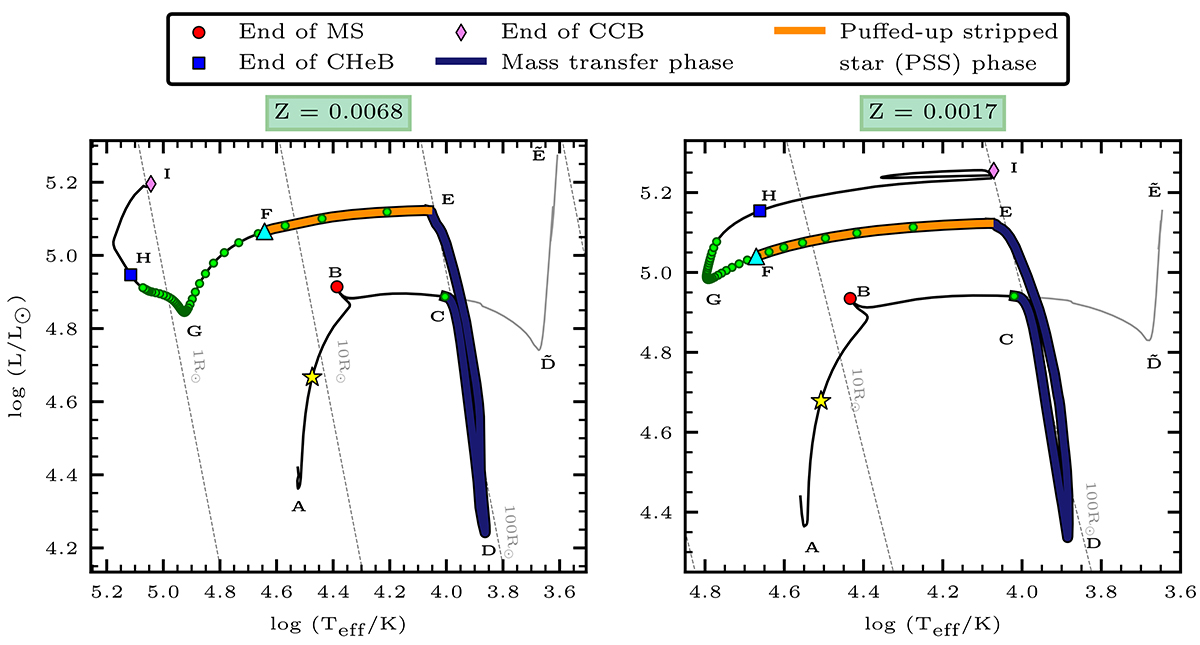
Hertzsprung–Russel diagram of two representative binary models of 16 M⊙ at metallicities 0.0068 (LMC) and 0.0017(0.1 Z⊙) starting from main sequence (MS) till core carbon depletion. Dotted diagonal lines represent lines of constant radius. The evolution stages are marked and labelled in various colours. The red dot represents the end of the main sequence (MS), and the blue square and pink diamond represent the end of core He burning (CHeB) and core carbon burning (CCB), respectively. The blue region represents the mass transfer phase, and the orange region shows the puffed-up stripped star (PSS) phase. Letters A to I mark the important instances in the star’s evolution (see text). The grey track (![]() ) shows the evolutionary pathway of the stars had they not been in a binary configuration (i.e., single stellar evolution). The green dots are placed at 20 000 years starting from RLOF. The cyan triangle represents the position where the flux of the primary in an HST 450 optical filter drops below the flux of the companion. For this example, we assumed that the companion has the same luminosity and temperature as the primary had at 75% of its MS lifetime (as indicated by the yellow star, see Sect. 4.2 for further discussion).
) shows the evolutionary pathway of the stars had they not been in a binary configuration (i.e., single stellar evolution). The green dots are placed at 20 000 years starting from RLOF. The cyan triangle represents the position where the flux of the primary in an HST 450 optical filter drops below the flux of the companion. For this example, we assumed that the companion has the same luminosity and temperature as the primary had at 75% of its MS lifetime (as indicated by the yellow star, see Sect. 4.2 for further discussion).
Current usage metrics show cumulative count of Article Views (full-text article views including HTML views, PDF and ePub downloads, according to the available data) and Abstracts Views on Vision4Press platform.
Data correspond to usage on the plateform after 2015. The current usage metrics is available 48-96 hours after online publication and is updated daily on week days.
Initial download of the metrics may take a while.