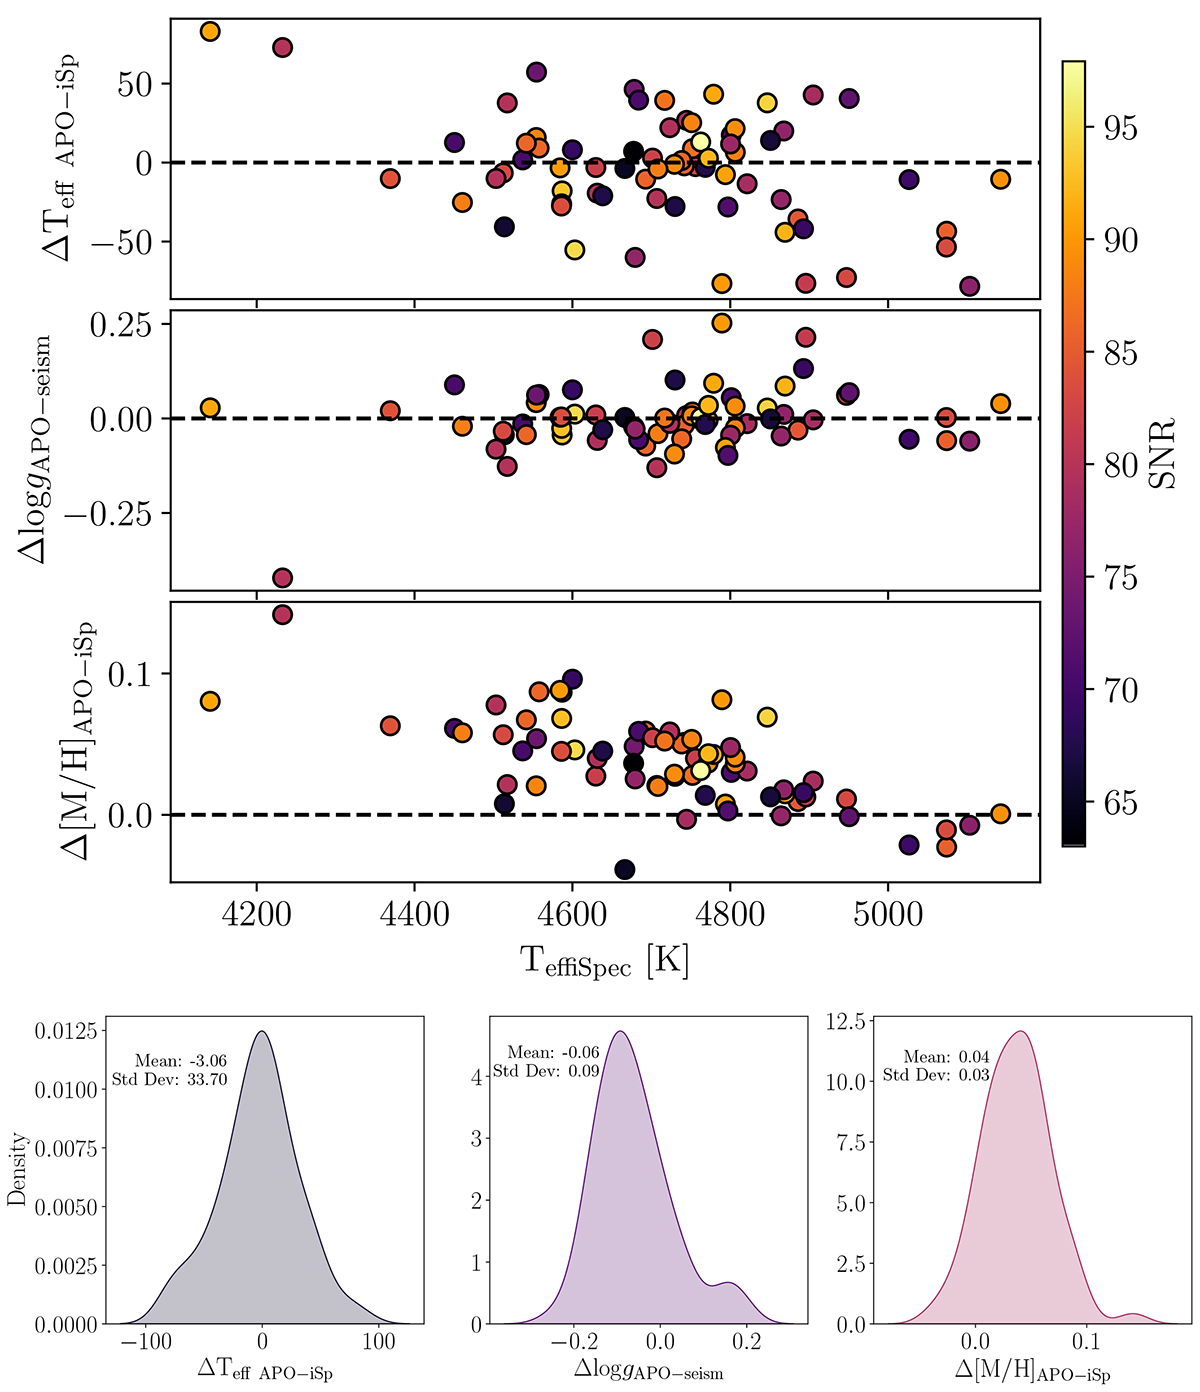
Fig. 5.
Download original image
APOGEE comparison. Top: differences between our computed and adopted atmospheric parameters and the APOGEE results as a function of spectroscopic Teff. The color-coding expresses the S/N of the targets. The temperatures and metallicities were directly derived from spectroscopy, while the log g were calculated using the scaling relation of Eq. (1). Bottom: Kernel density estimation of the three deltas together with their mean differences and dispersions.
Current usage metrics show cumulative count of Article Views (full-text article views including HTML views, PDF and ePub downloads, according to the available data) and Abstracts Views on Vision4Press platform.
Data correspond to usage on the plateform after 2015. The current usage metrics is available 48-96 hours after online publication and is updated daily on week days.
Initial download of the metrics may take a while.