Fig. 3.
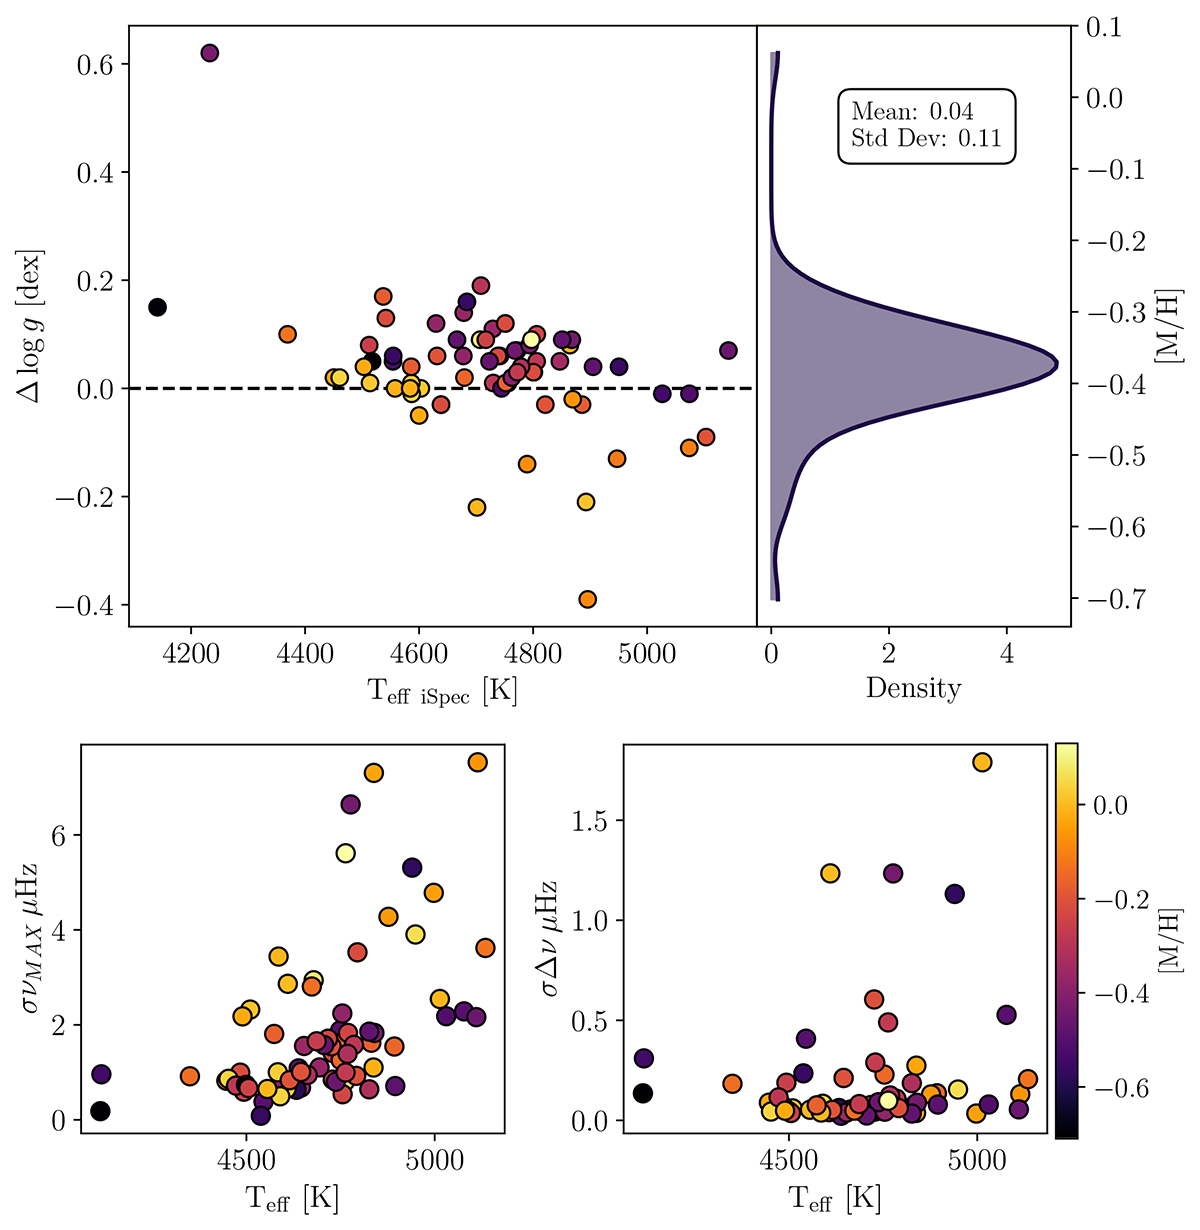
Download original image
Spectroscopic and asteroseismic surface gravity values and the asteroseismic maximum frequency and frequency separation. Top: Difference between the outcomes derived from the asteroseismic scaling relation of Eq. (1) and the spectroscopic log g. On the right the corresponding KDE distribution is shown. Larger deviations between the two methods are observed for higher metallicity and the three coldest stars. Bottom: Uncertainties in the seismic maximum frequency and the separation Δν are depicted as a function of temperature. In all cases, the color-coding is determined based on the global metallicity calculated using iSpec.
Current usage metrics show cumulative count of Article Views (full-text article views including HTML views, PDF and ePub downloads, according to the available data) and Abstracts Views on Vision4Press platform.
Data correspond to usage on the plateform after 2015. The current usage metrics is available 48-96 hours after online publication and is updated daily on week days.
Initial download of the metrics may take a while.