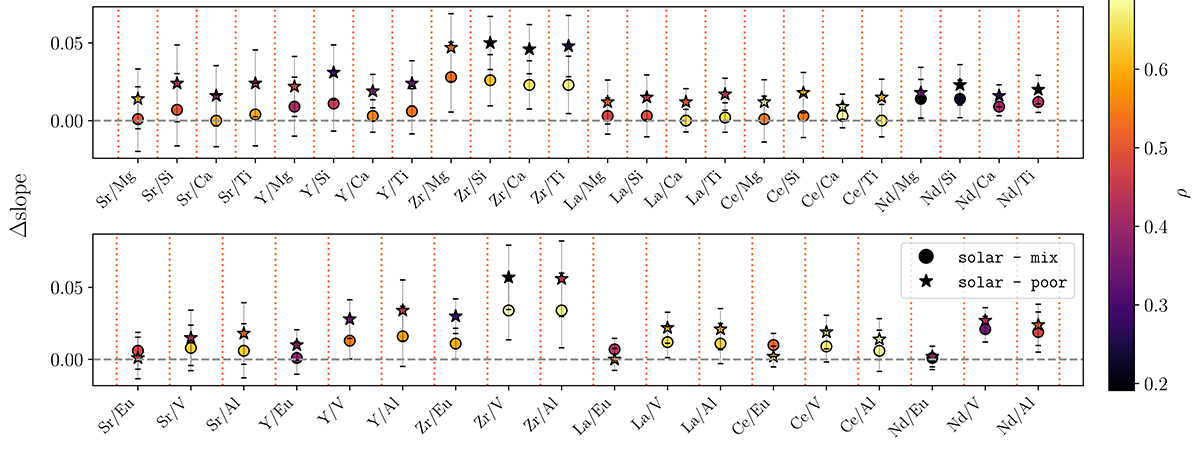
Fig. 14.
Download original image
Slope differences for each element combination of each ratio. The dot and star points specifically highlight variations between the solar and mix groups, and the solar and poor groups, respectively. The color-coding represents the correlation coefficient values. For the dot points, ρ is computed based on the mix group, whereas for the star points the correlation coefficients are derived from the poor group.
Current usage metrics show cumulative count of Article Views (full-text article views including HTML views, PDF and ePub downloads, according to the available data) and Abstracts Views on Vision4Press platform.
Data correspond to usage on the plateform after 2015. The current usage metrics is available 48-96 hours after online publication and is updated daily on week days.
Initial download of the metrics may take a while.