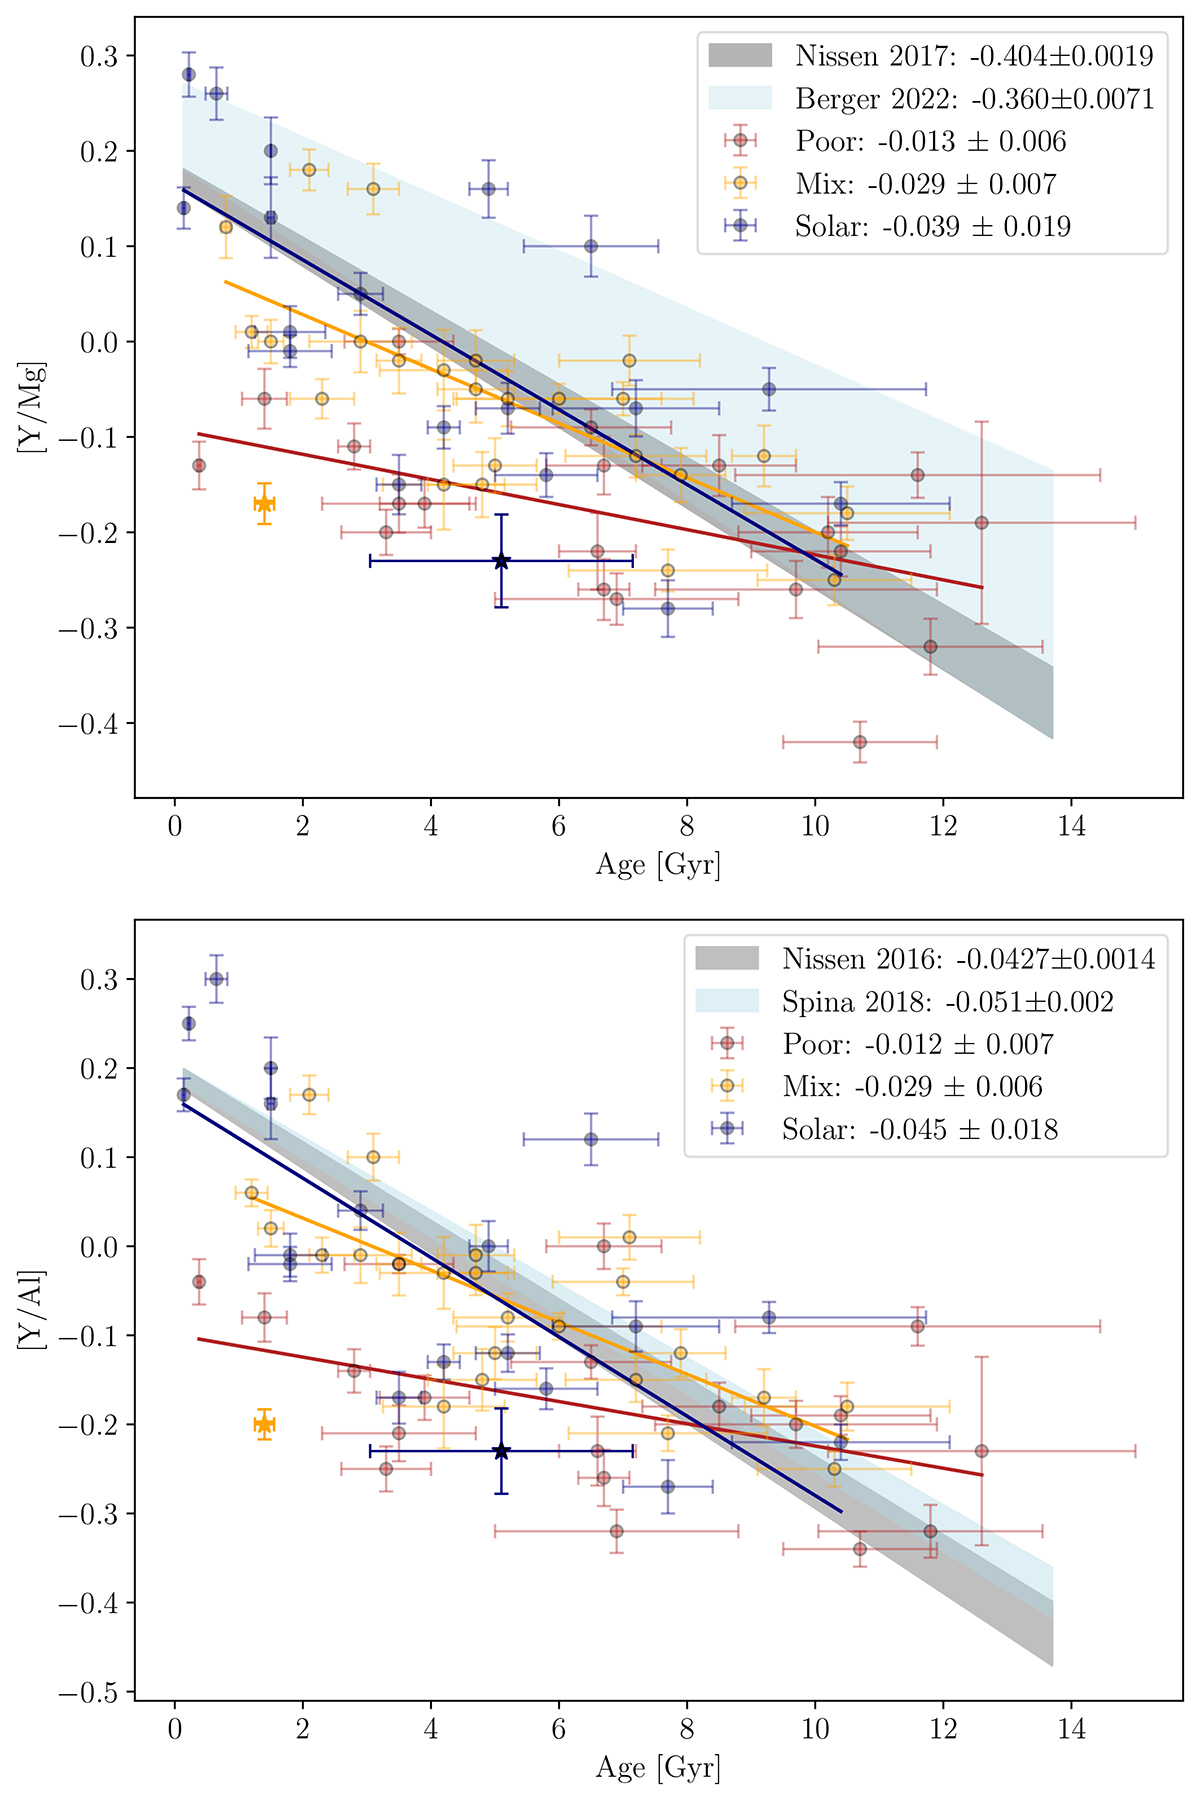
Fig. 11.
Download original image
[Y/Mg] and [Y/Al]-ages linear relations. Top: [Y/Mg] vs. ages for stars with age < 14 Gyr. Bottom: [Y/Al] vs. ages for the same stellar selection. For both panels the three solid lines represent the relation identified for the three distinct metallicity groups outlined in Table 2. The gray and light blue shaded regions display the previously established relationships from the literature derived for solar twin stars, which we compare with the findings for our solar group (in blue). The figure legends (see insets) provide the slopes of each relation along with their associated uncertainties. The two giants marked with star symbols are two possible evolved blue stragglers that have been excluded from the fitting procedures, as discussed in Sect. 4.3.
Current usage metrics show cumulative count of Article Views (full-text article views including HTML views, PDF and ePub downloads, according to the available data) and Abstracts Views on Vision4Press platform.
Data correspond to usage on the plateform after 2015. The current usage metrics is available 48-96 hours after online publication and is updated daily on week days.
Initial download of the metrics may take a while.