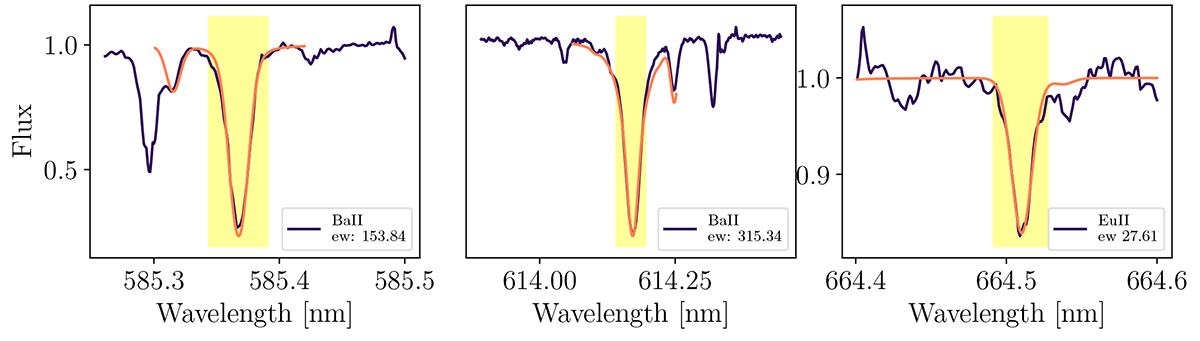
Fig. 10.
Download original image
Profile of two Ba II lines at 585.366 and 614.171 nm and the Eu II at 664.5101 nm for the giant J04034842+1551272. The darker lines represent the observed spectra, orange denotes the synthetic fit, the yellow denotes the area in which the abundances are computed. The values of the equivalent widths of each line are shown in each panel.
Current usage metrics show cumulative count of Article Views (full-text article views including HTML views, PDF and ePub downloads, according to the available data) and Abstracts Views on Vision4Press platform.
Data correspond to usage on the plateform after 2015. The current usage metrics is available 48-96 hours after online publication and is updated daily on week days.
Initial download of the metrics may take a while.