Fig. 4
Download original image
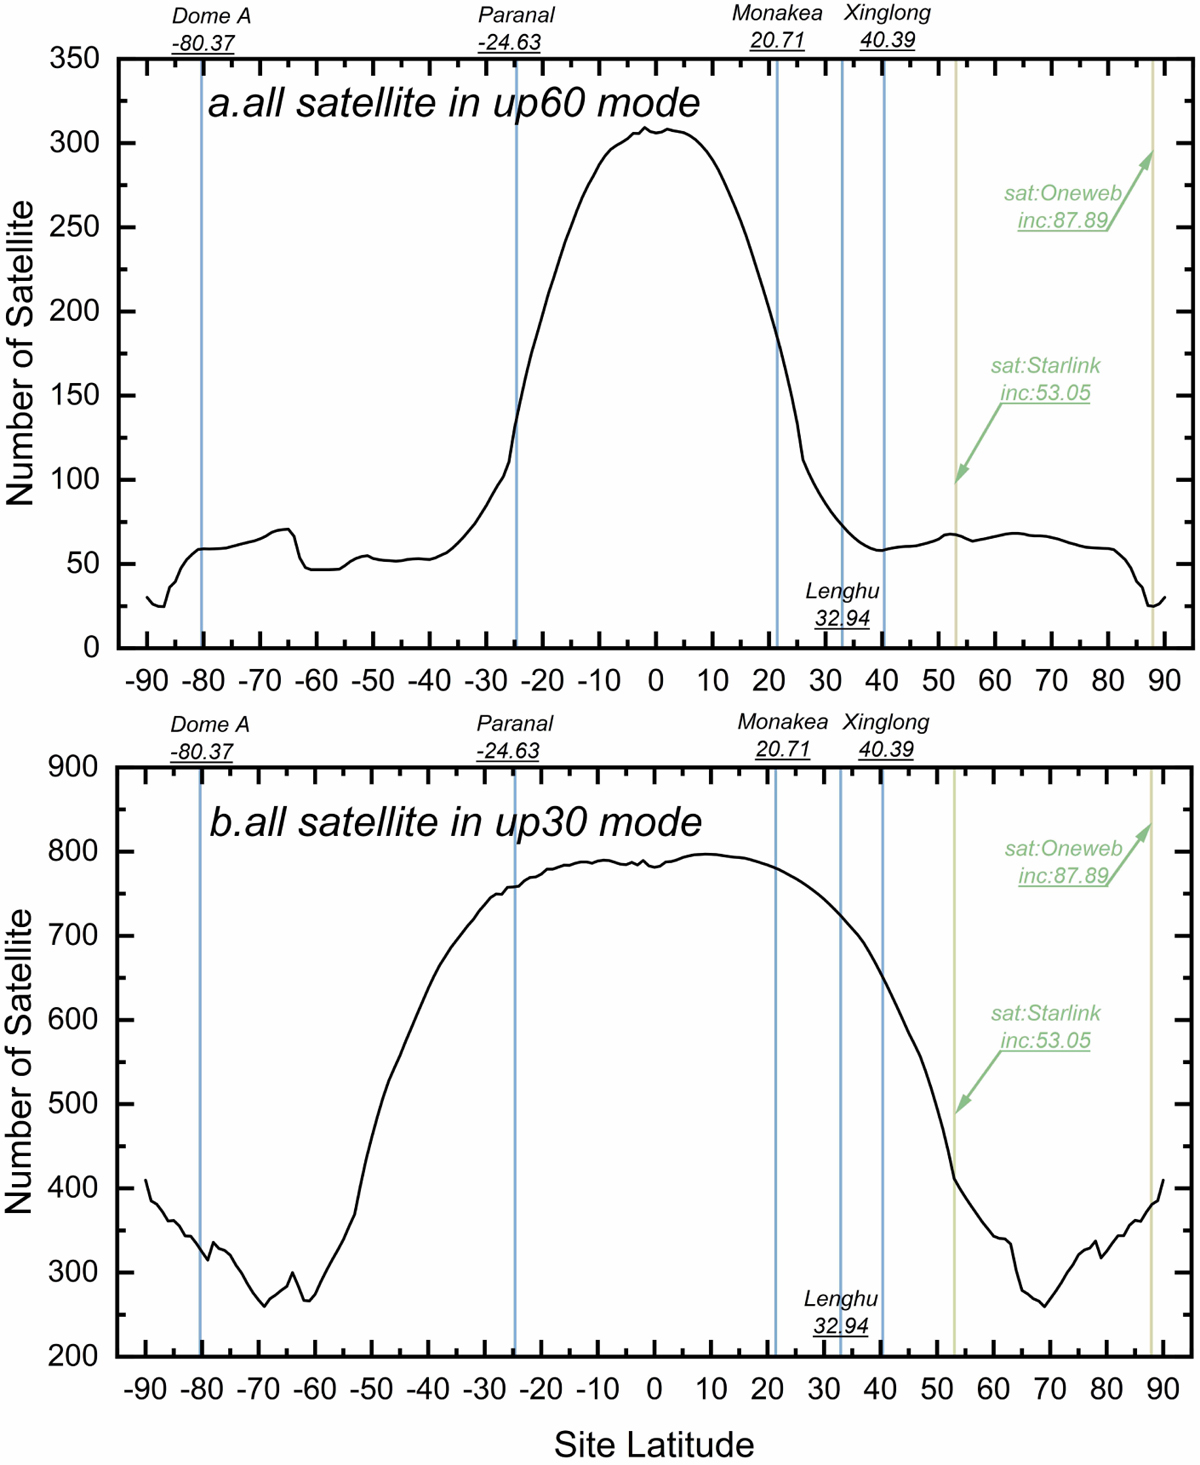
Observable satellite count at different latitudes, considering all satellites, with the equatorial region being most severely affected. The upper figure depicts the count of observable satellites within a 30 degree field of view centred on the zenith at the observatory, while the lower figure represents the count of observable satellites within a 60 degree field of view centred on the zenith at the observatory.
Current usage metrics show cumulative count of Article Views (full-text article views including HTML views, PDF and ePub downloads, according to the available data) and Abstracts Views on Vision4Press platform.
Data correspond to usage on the plateform after 2015. The current usage metrics is available 48-96 hours after online publication and is updated daily on week days.
Initial download of the metrics may take a while.