Fig. 9
Download original image
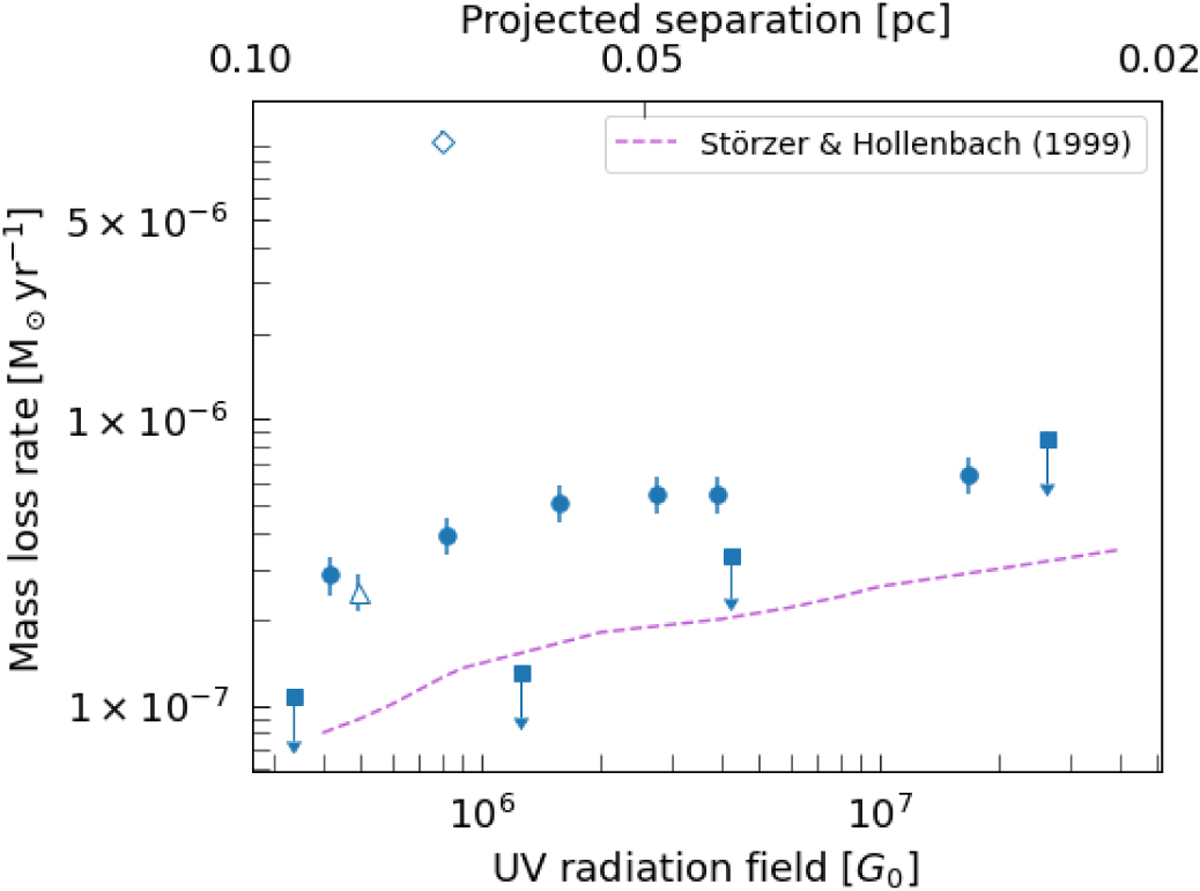
Mass-loss rate vs incident radiation field. The dots represent well-detected proplyds, and the squares denote the proplyds with higher uncertainty. The diamond (244–440) and the triangle (203–504) mark proplyds irradiated by θ2 Ori A. The dashed purple line represents a model prediction for disks with a radius of 40 au (Storzer & Hollenbach 1999).
Current usage metrics show cumulative count of Article Views (full-text article views including HTML views, PDF and ePub downloads, according to the available data) and Abstracts Views on Vision4Press platform.
Data correspond to usage on the plateform after 2015. The current usage metrics is available 48-96 hours after online publication and is updated daily on week days.
Initial download of the metrics may take a while.