Fig. 6
Download original image
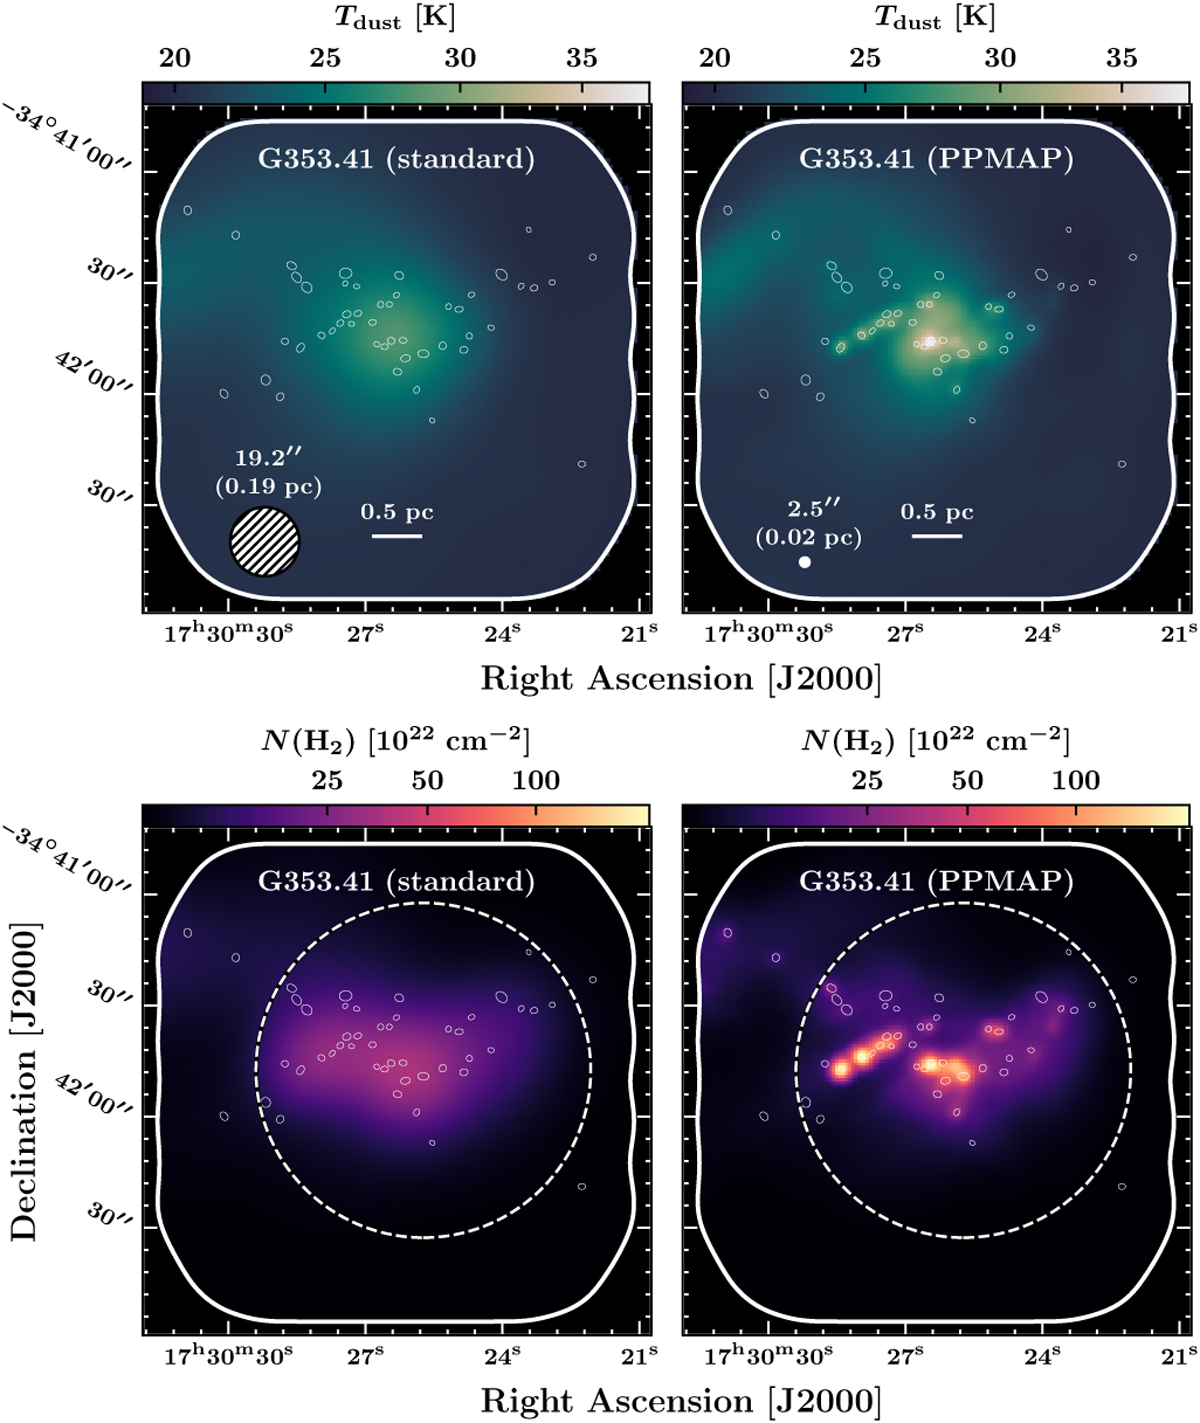
Resolution enhancement of the dust temperature (top panels) and column density (bottom panels) images, achieved through the application of PPMAP to the G353.41 dataset. The left panels display the maps derived by smoothing all input images to a uniform resolution of 19.2″, while the right panels represent the PPMAP images at an angular resolution of 2.5″. White ellipses outline continuum cores identified by Louvet et al. (2023) in the ALMA 1.3 mm images at 0.4−0.9″ angular resolution. The larger dashed circles represent the footprint of the ATLASGAL source AGAL353.409–00.361 (Contreras et al. 2013, Urquhart et al. 2014).
Current usage metrics show cumulative count of Article Views (full-text article views including HTML views, PDF and ePub downloads, according to the available data) and Abstracts Views on Vision4Press platform.
Data correspond to usage on the plateform after 2015. The current usage metrics is available 48-96 hours after online publication and is updated daily on week days.
Initial download of the metrics may take a while.