Open Access
Fig. 5
Download original image
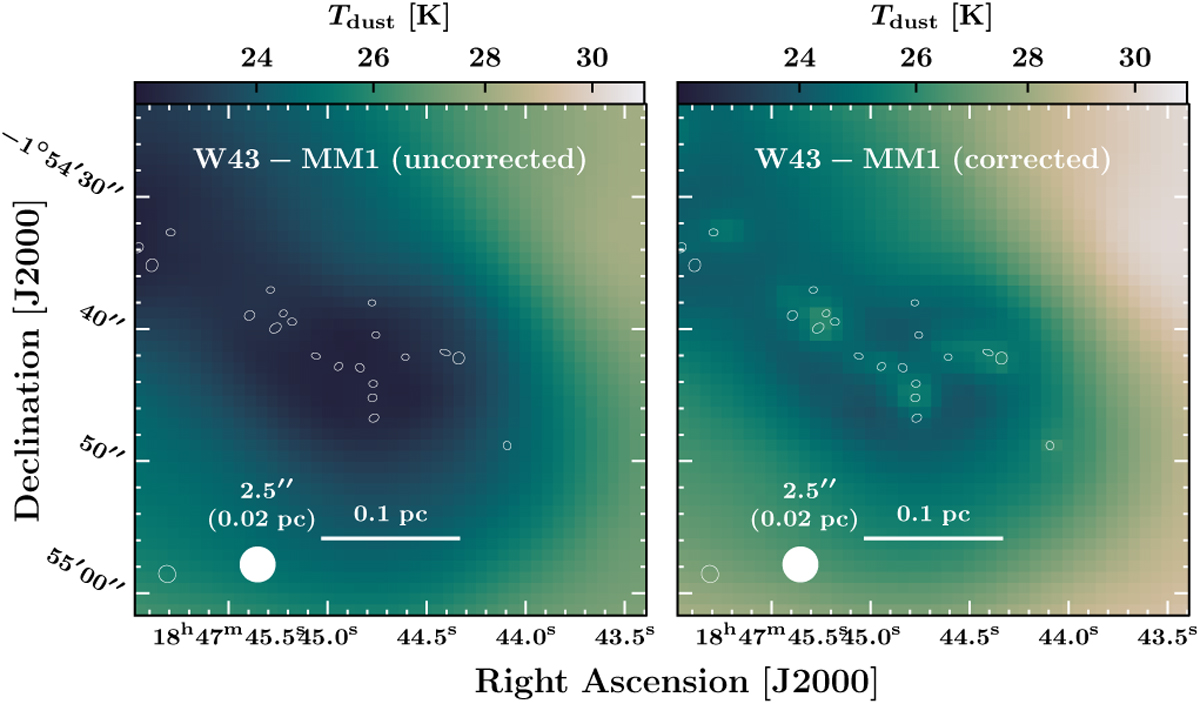
Temperature correction of the PPMAP images illustrated. The left panels displays the W43-MM1 Main-West image before correction, while the right panels presents the post-corrected map. White ellipses outline continuum cores identified by Louvet et al. (2023) in the ALMA 1.3 mm images at 0.4–0.9″ angular resolution.
Current usage metrics show cumulative count of Article Views (full-text article views including HTML views, PDF and ePub downloads, according to the available data) and Abstracts Views on Vision4Press platform.
Data correspond to usage on the plateform after 2015. The current usage metrics is available 48-96 hours after online publication and is updated daily on week days.
Initial download of the metrics may take a while.