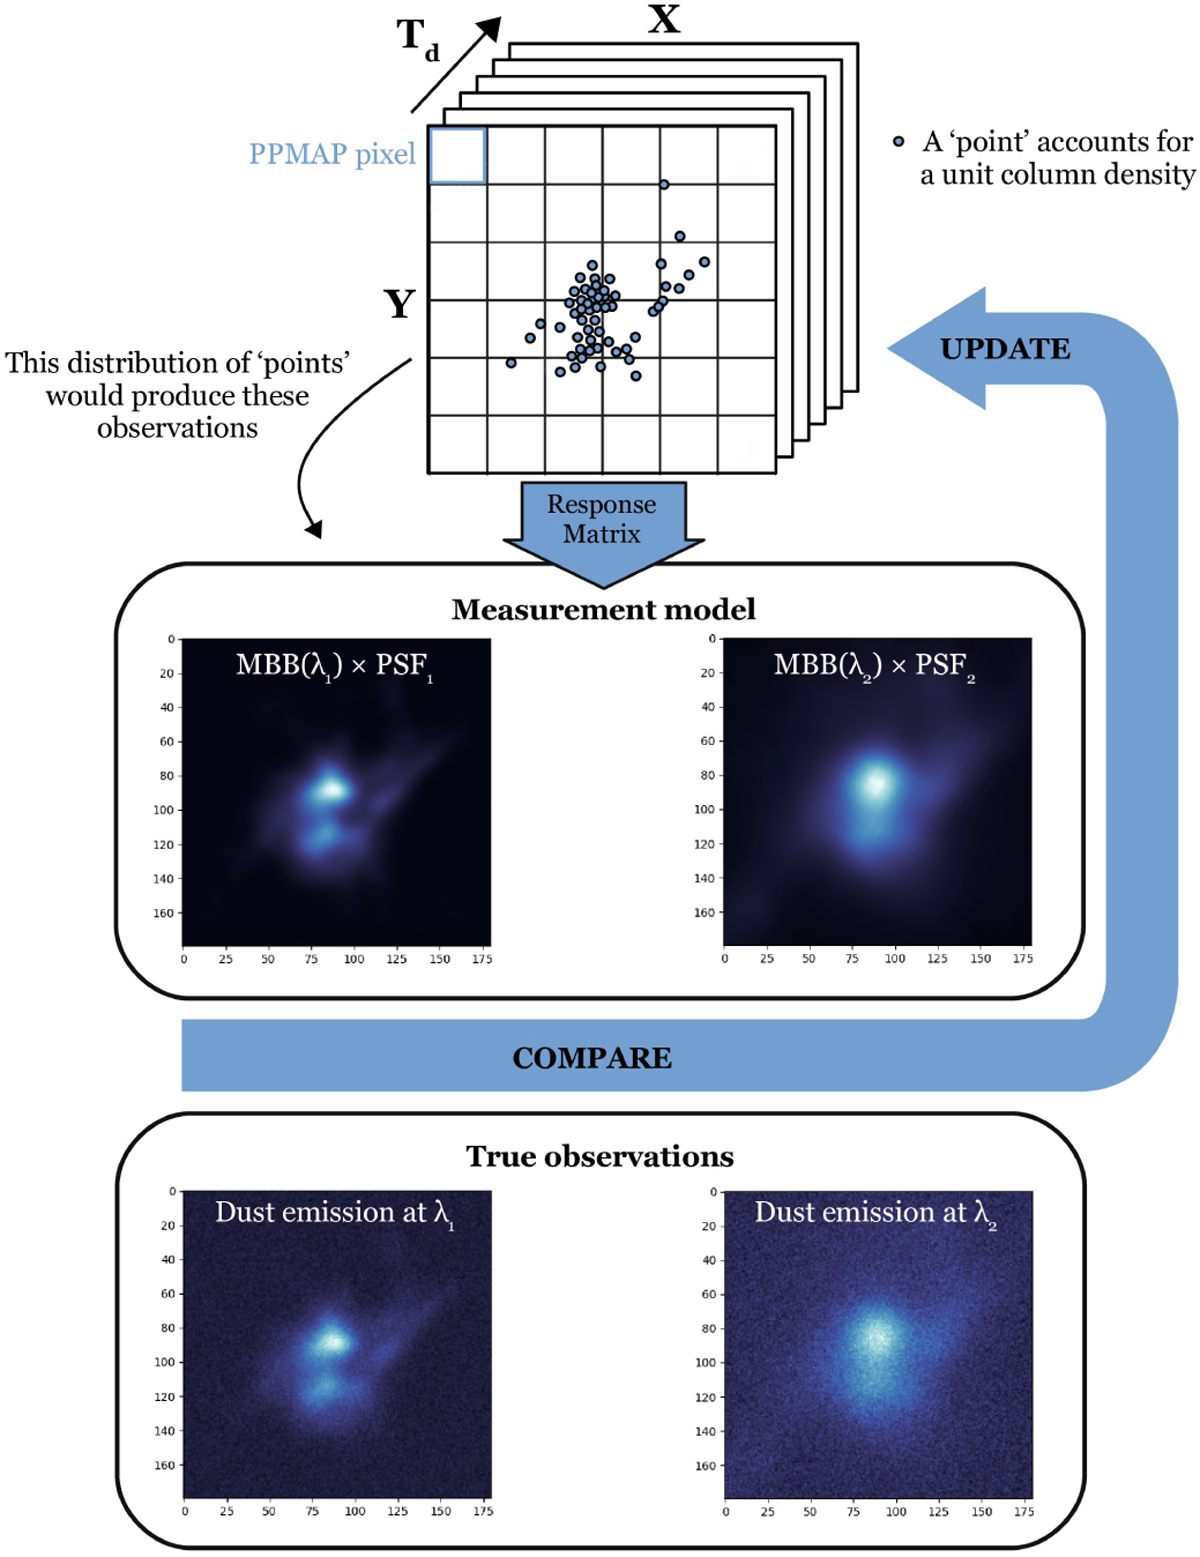
Fig. 3
Download original image
Schematic representation of the PPMAP iterative process. G012.80 images (at λ1 = 350 µm and λ2 = 870 µm) are used for illustrative purpose. In the upper part, we represent how PPMAP distributes “points” in a continuous state space (X, Y, Tdust) that can be divided into finite cells (corresponding to PPMAP pixels, that is, with a size fixed by the user, independent of the pixel size of the observed images). This distribution is then translated into a synthetic continuum emission map through the MBB description, taking into account the PSF of the instruments. Synthetic observations are finally compared to true observations, allowing to update the distribution of points. These iterative steps are repeated until the model converges.
Current usage metrics show cumulative count of Article Views (full-text article views including HTML views, PDF and ePub downloads, according to the available data) and Abstracts Views on Vision4Press platform.
Data correspond to usage on the plateform after 2015. The current usage metrics is available 48-96 hours after online publication and is updated daily on week days.
Initial download of the metrics may take a while.