Fig. 2
Download original image
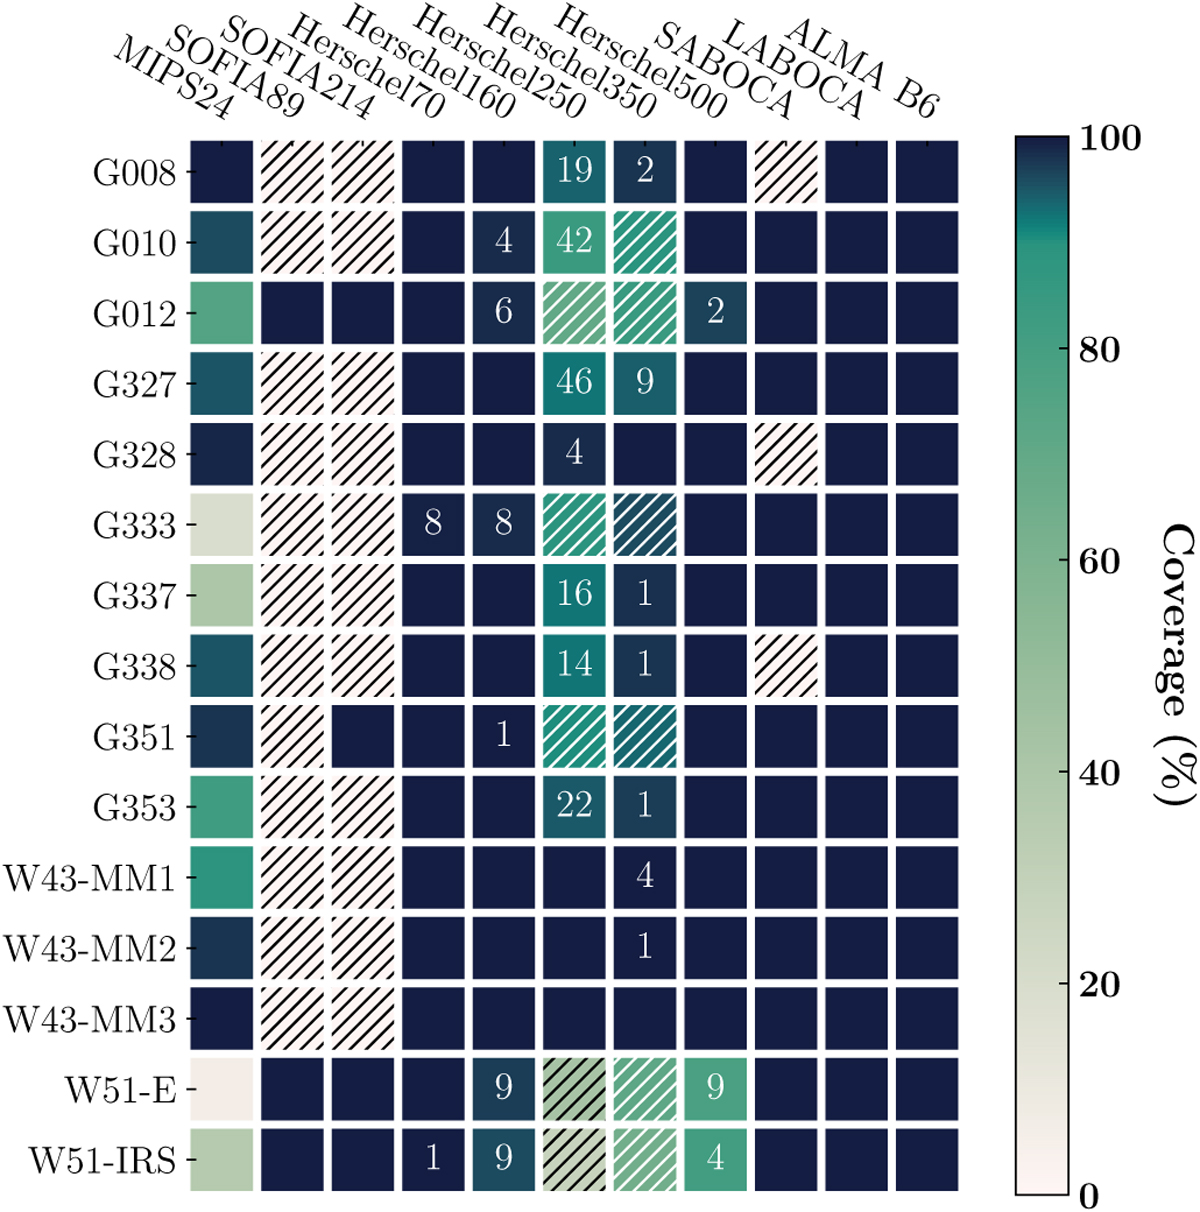
Data coverage chart. The color scale represents the percentage of observed and unsaturated pixels in each pair of region and map. Spitzer/IRAC data, which has no saturated pixels in the regions studied, is not shown here. The numbers account for the amount of pixels replaced through astrofix (example: in G012.80, the Hi-GAL 160 µm map has 6 saturated pixels that were interpolated). Maps that are either missing or discarded from the analysis are hatched.
Current usage metrics show cumulative count of Article Views (full-text article views including HTML views, PDF and ePub downloads, according to the available data) and Abstracts Views on Vision4Press platform.
Data correspond to usage on the plateform after 2015. The current usage metrics is available 48-96 hours after online publication and is updated daily on week days.
Initial download of the metrics may take a while.