Fig. B.1
Download original image
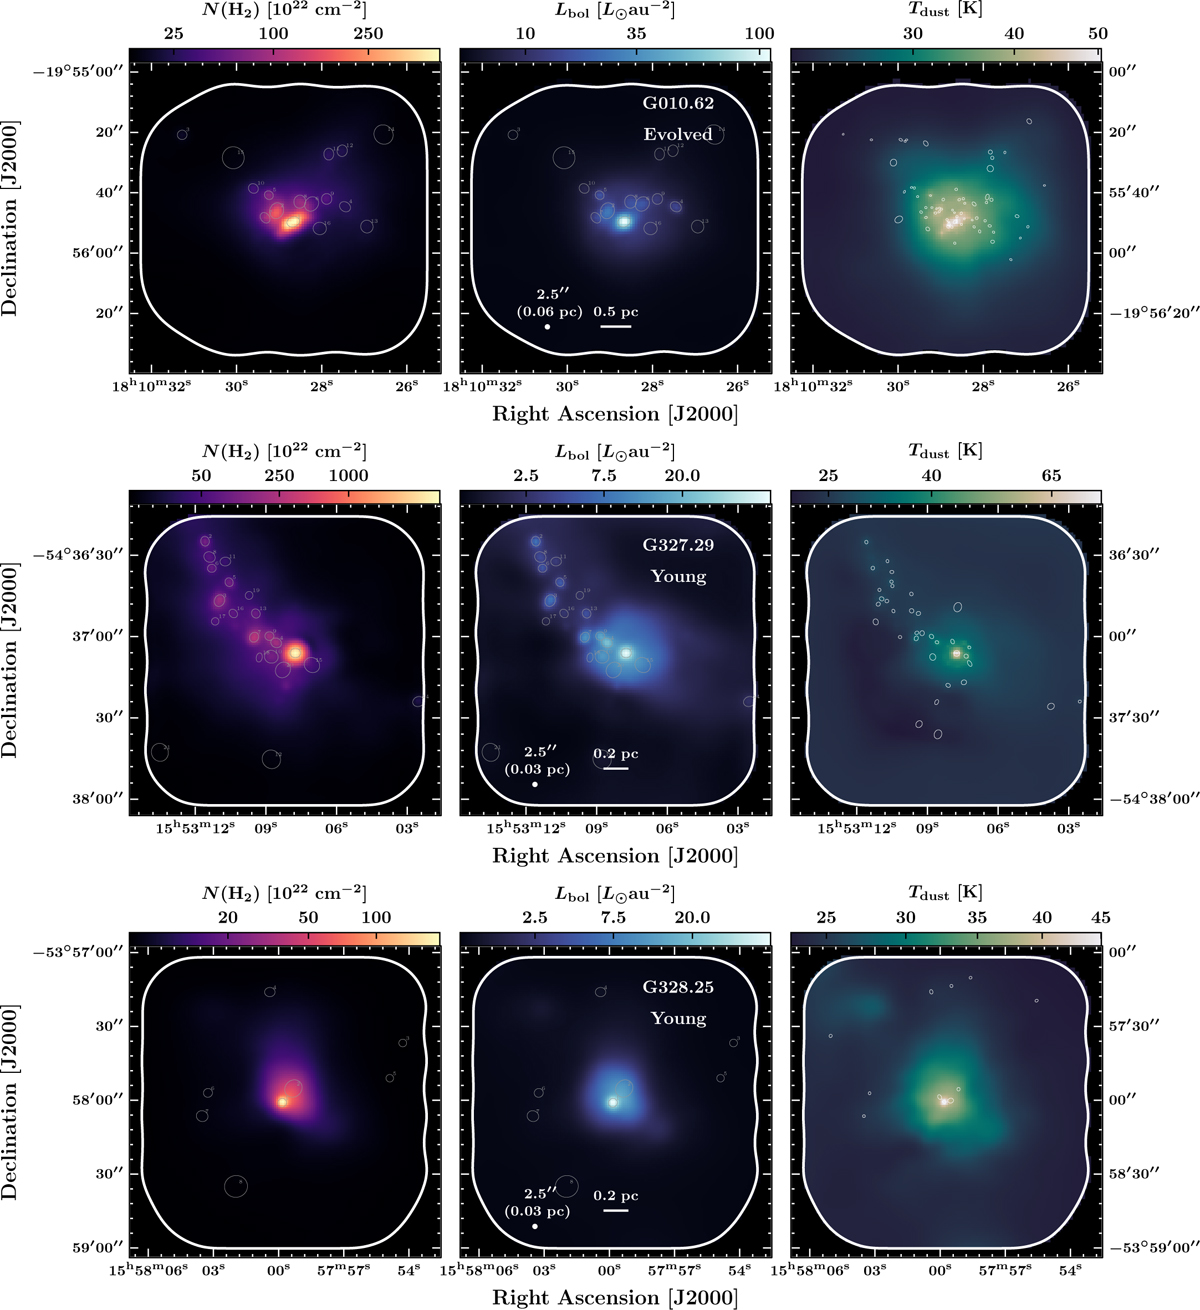
PPMAP products illustrated for the remaining protoclusters. From left to right: column density map (N(H2)), bolometric luminosity (Lbol), corrected dust temperature (Tdust). White continuous contours outline the ALMA 1.3 mm mosaic areas. The luminosity peaks extracted from the PPMAP luminosity maps (see Sect. 5.2) are overlaid in gray. The continuum cores identified by Louvet et al. (2023) in the ALMA 1.3 mm images are overlaid in white. The size of the ellipses reflects the FWHM of the sources.
Current usage metrics show cumulative count of Article Views (full-text article views including HTML views, PDF and ePub downloads, according to the available data) and Abstracts Views on Vision4Press platform.
Data correspond to usage on the plateform after 2015. The current usage metrics is available 48-96 hours after online publication and is updated daily on week days.
Initial download of the metrics may take a while.