Fig. A.4
Download original image
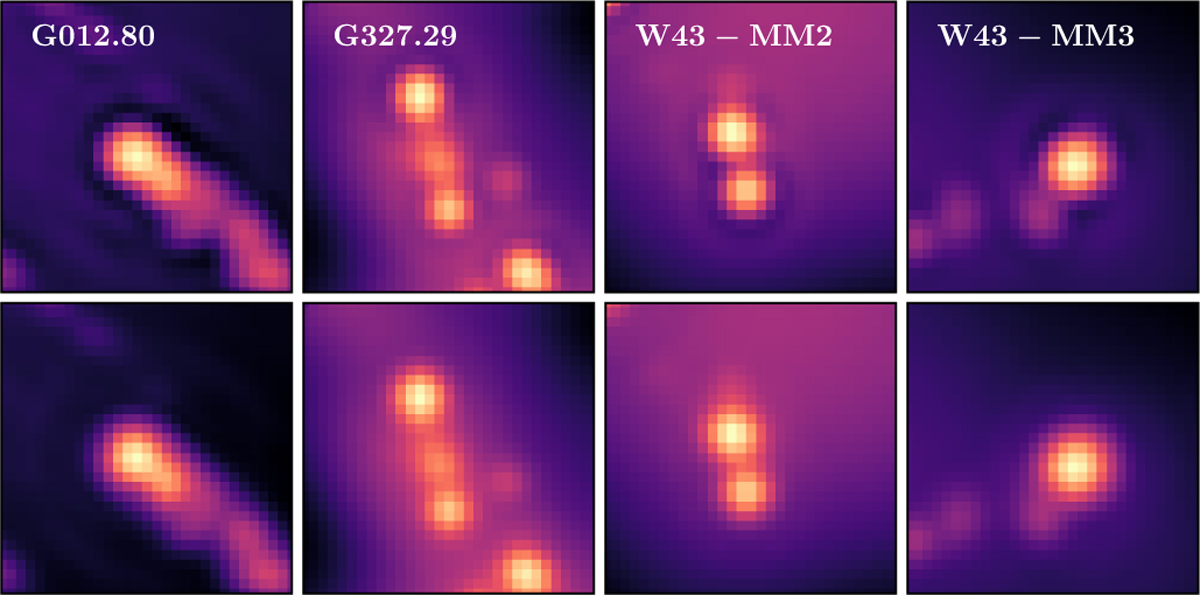
Zooming in on characteristic ring-like artifacts, we present four column density maps (G012.80, G327.29, W43-MM2, and W43-MM3) in a left-to-right sequence. The top panel illustrates the initial PPMAP outputs, while the bottom panel displays the maps after undergoing post-processing as outlined in Appendix A.4. The color scale is logarithmic, to enhance visibility.
Current usage metrics show cumulative count of Article Views (full-text article views including HTML views, PDF and ePub downloads, according to the available data) and Abstracts Views on Vision4Press platform.
Data correspond to usage on the plateform after 2015. The current usage metrics is available 48-96 hours after online publication and is updated daily on week days.
Initial download of the metrics may take a while.