Open Access
Fig. A.3
Download original image
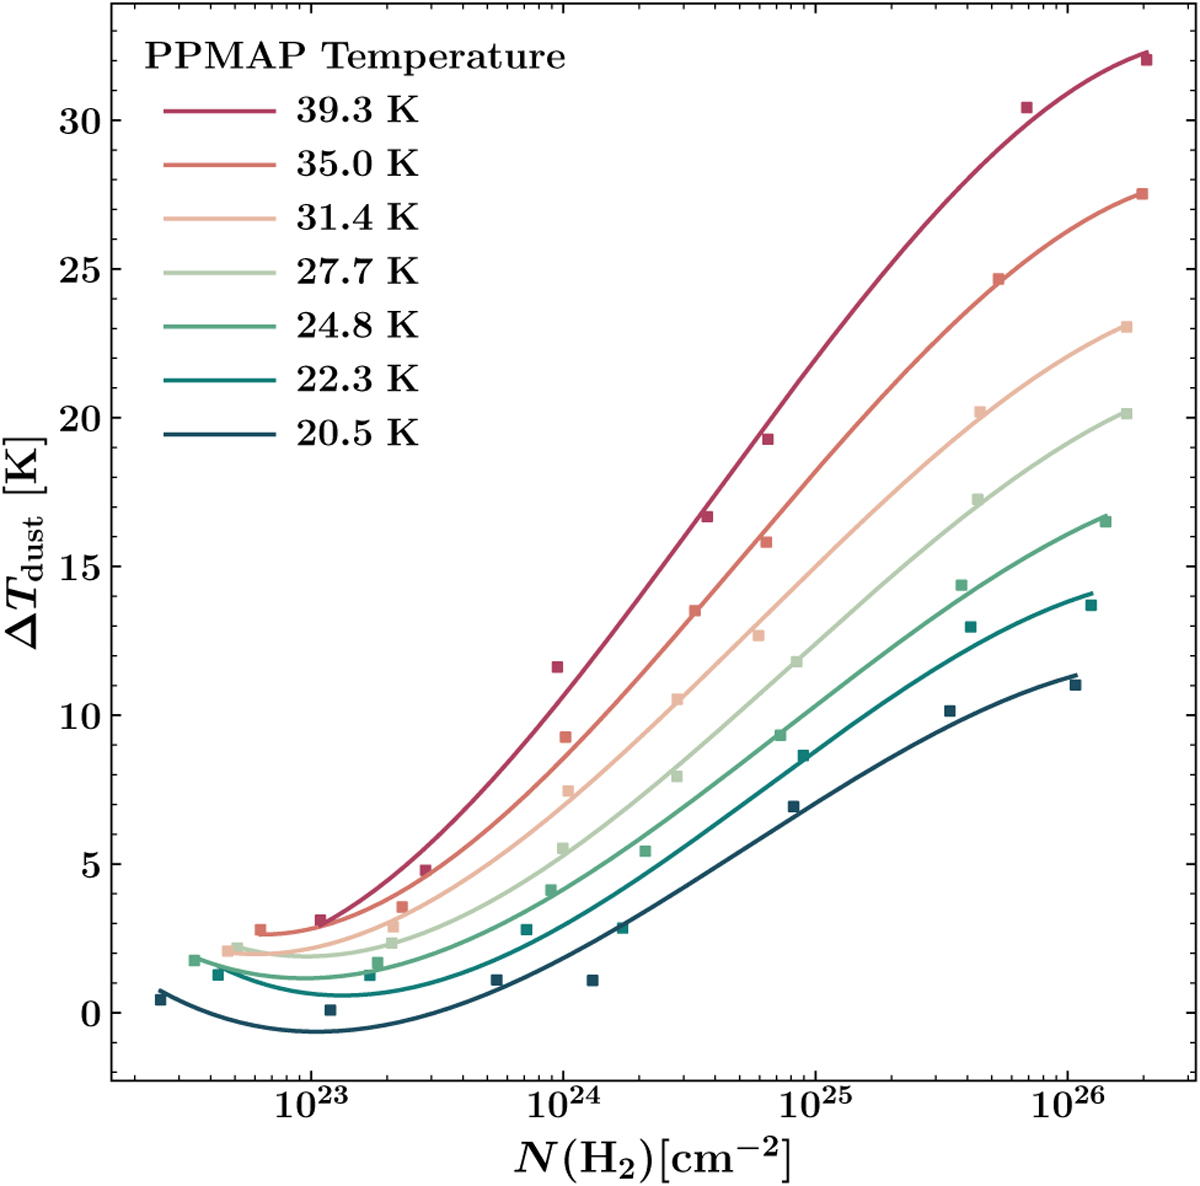
Temperature correction ∆Tdust as a function of the PPMAP column density N(H2). The correction is shown for different input temperatures, spanning 20.5 K to 39.3 K. Data points are interpolated using cubic splines. N.B.: 99% of the PPMAP-derived column densities are below 8 × 1023 cm−2.
Current usage metrics show cumulative count of Article Views (full-text article views including HTML views, PDF and ePub downloads, according to the available data) and Abstracts Views on Vision4Press platform.
Data correspond to usage on the plateform after 2015. The current usage metrics is available 48-96 hours after online publication and is updated daily on week days.
Initial download of the metrics may take a while.