Fig. A.2
Download original image
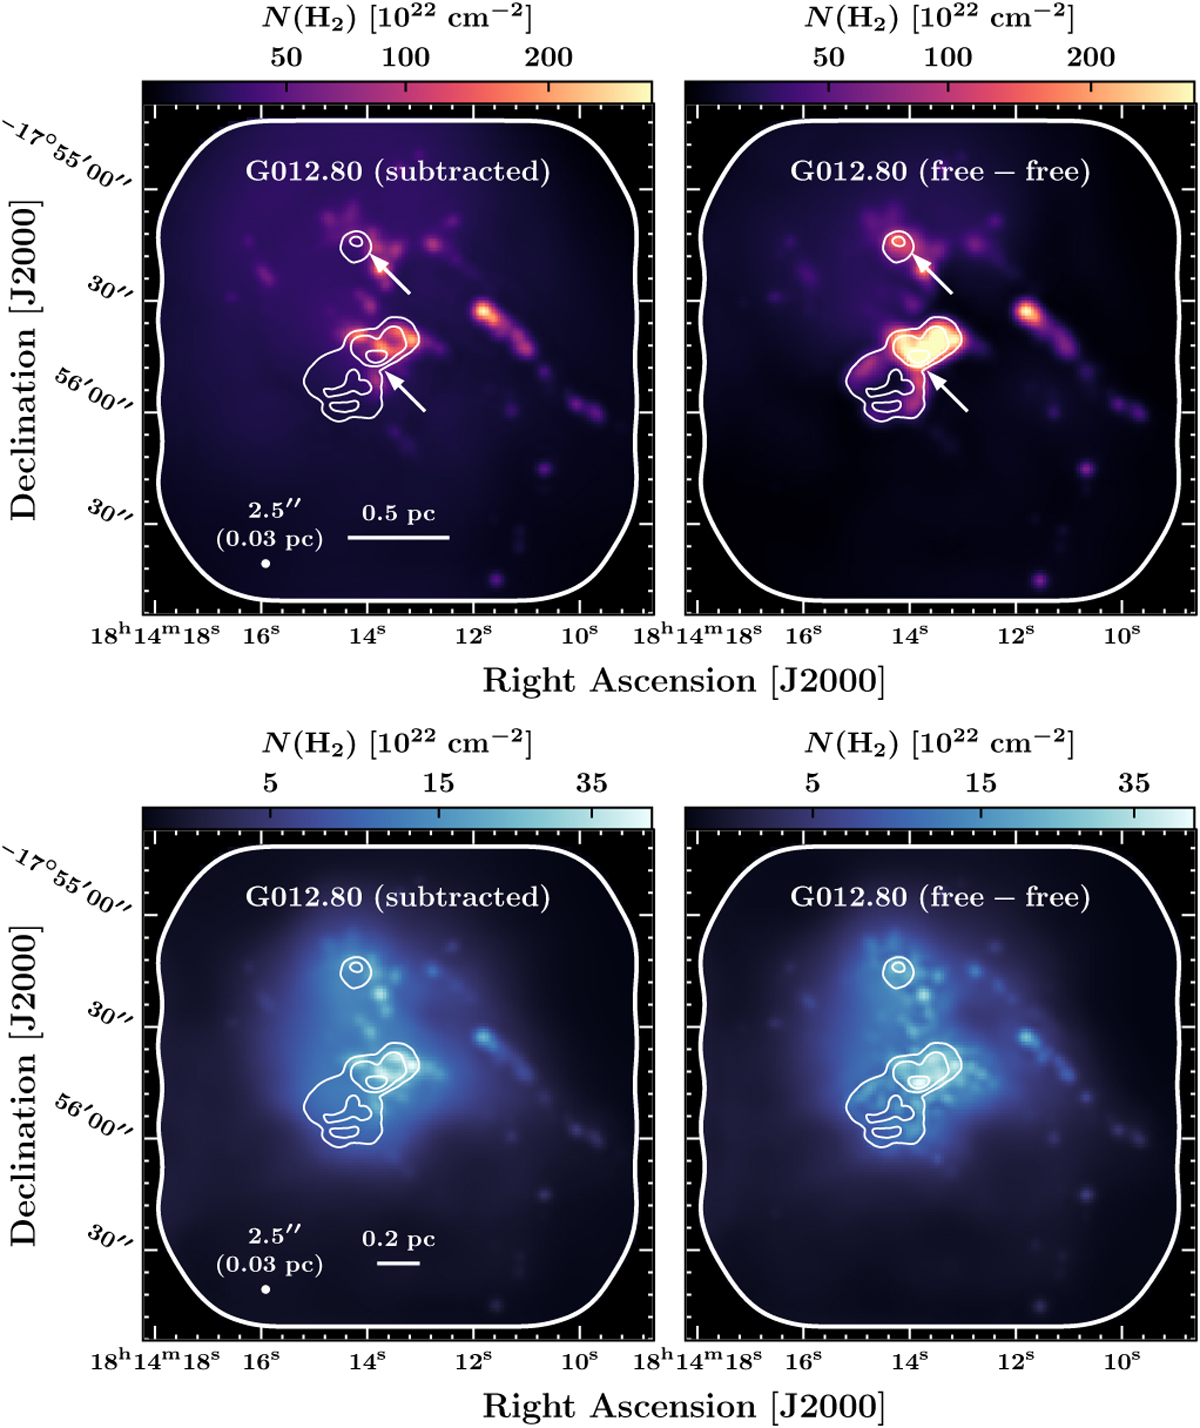
Demonstration of the impact of free-free subtraction, carried out by Galván-Madrid et al. (in prep.), on the PPMAP-derived column density (top panel) and luminosity (bottom panel) maps of G012.80. The left panel displays the map obtained from the subtracted data (Run1), while the right panel depicts the outcomes achieved with the standard ALMA data (Run2). Superimposed white contours illustrate the H41α line emission, that traces regions dominated by free-free emission (contour levels: logarithmically spaced between 0.045 to 0.5 Jy beam−1). Arrows indicate the positions of the main HII regions.
Current usage metrics show cumulative count of Article Views (full-text article views including HTML views, PDF and ePub downloads, according to the available data) and Abstracts Views on Vision4Press platform.
Data correspond to usage on the plateform after 2015. The current usage metrics is available 48-96 hours after online publication and is updated daily on week days.
Initial download of the metrics may take a while.