Fig. 13
Download original image
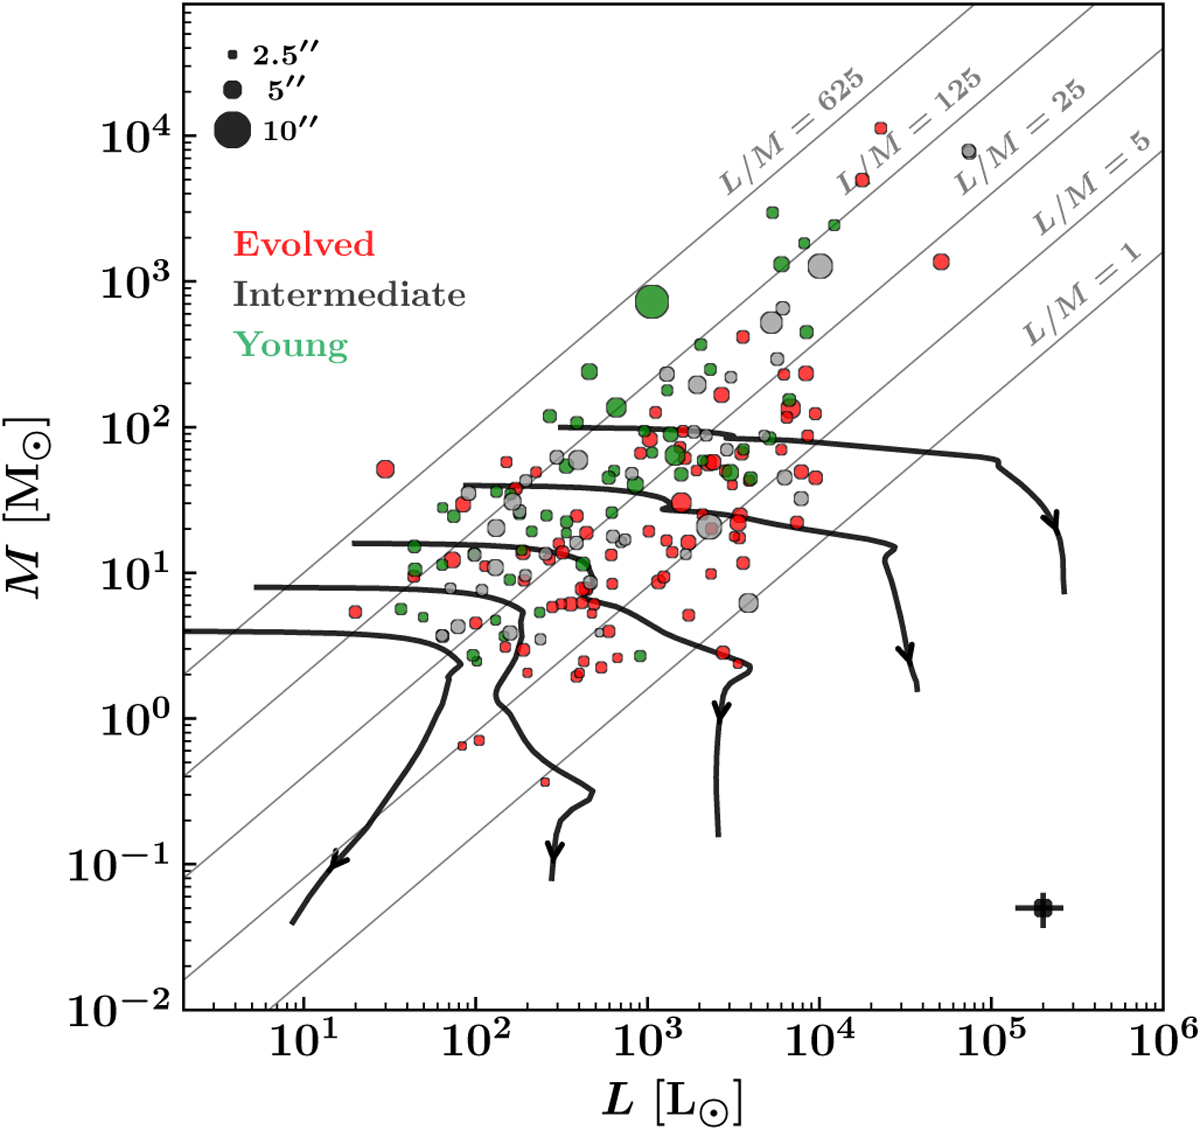
Mass and luminosity distribution of PPMAP luminosity peaks extracted by getsf. Caveat: with a 2.5″ angular resolution and at a distance of 2–5.5 kpc, PPMAP sources may correspond to several cores and/or protostars. The size of the markers reflects the FWHM of the sources, while the color indicates the evolutionary stage of the proto-clusters they belong to. Typical error bars are shown in the bottom-right corner of the diagram. Solid black lines represent the evolutionary tracks from Motte et al. (2018a) and Duarte-Cabral et al. (2013) for final stellar masses of 2, 4, 8, 20 and 50 M⊙.
Current usage metrics show cumulative count of Article Views (full-text article views including HTML views, PDF and ePub downloads, according to the available data) and Abstracts Views on Vision4Press platform.
Data correspond to usage on the plateform after 2015. The current usage metrics is available 48-96 hours after online publication and is updated daily on week days.
Initial download of the metrics may take a while.