Fig. 12
Download original image
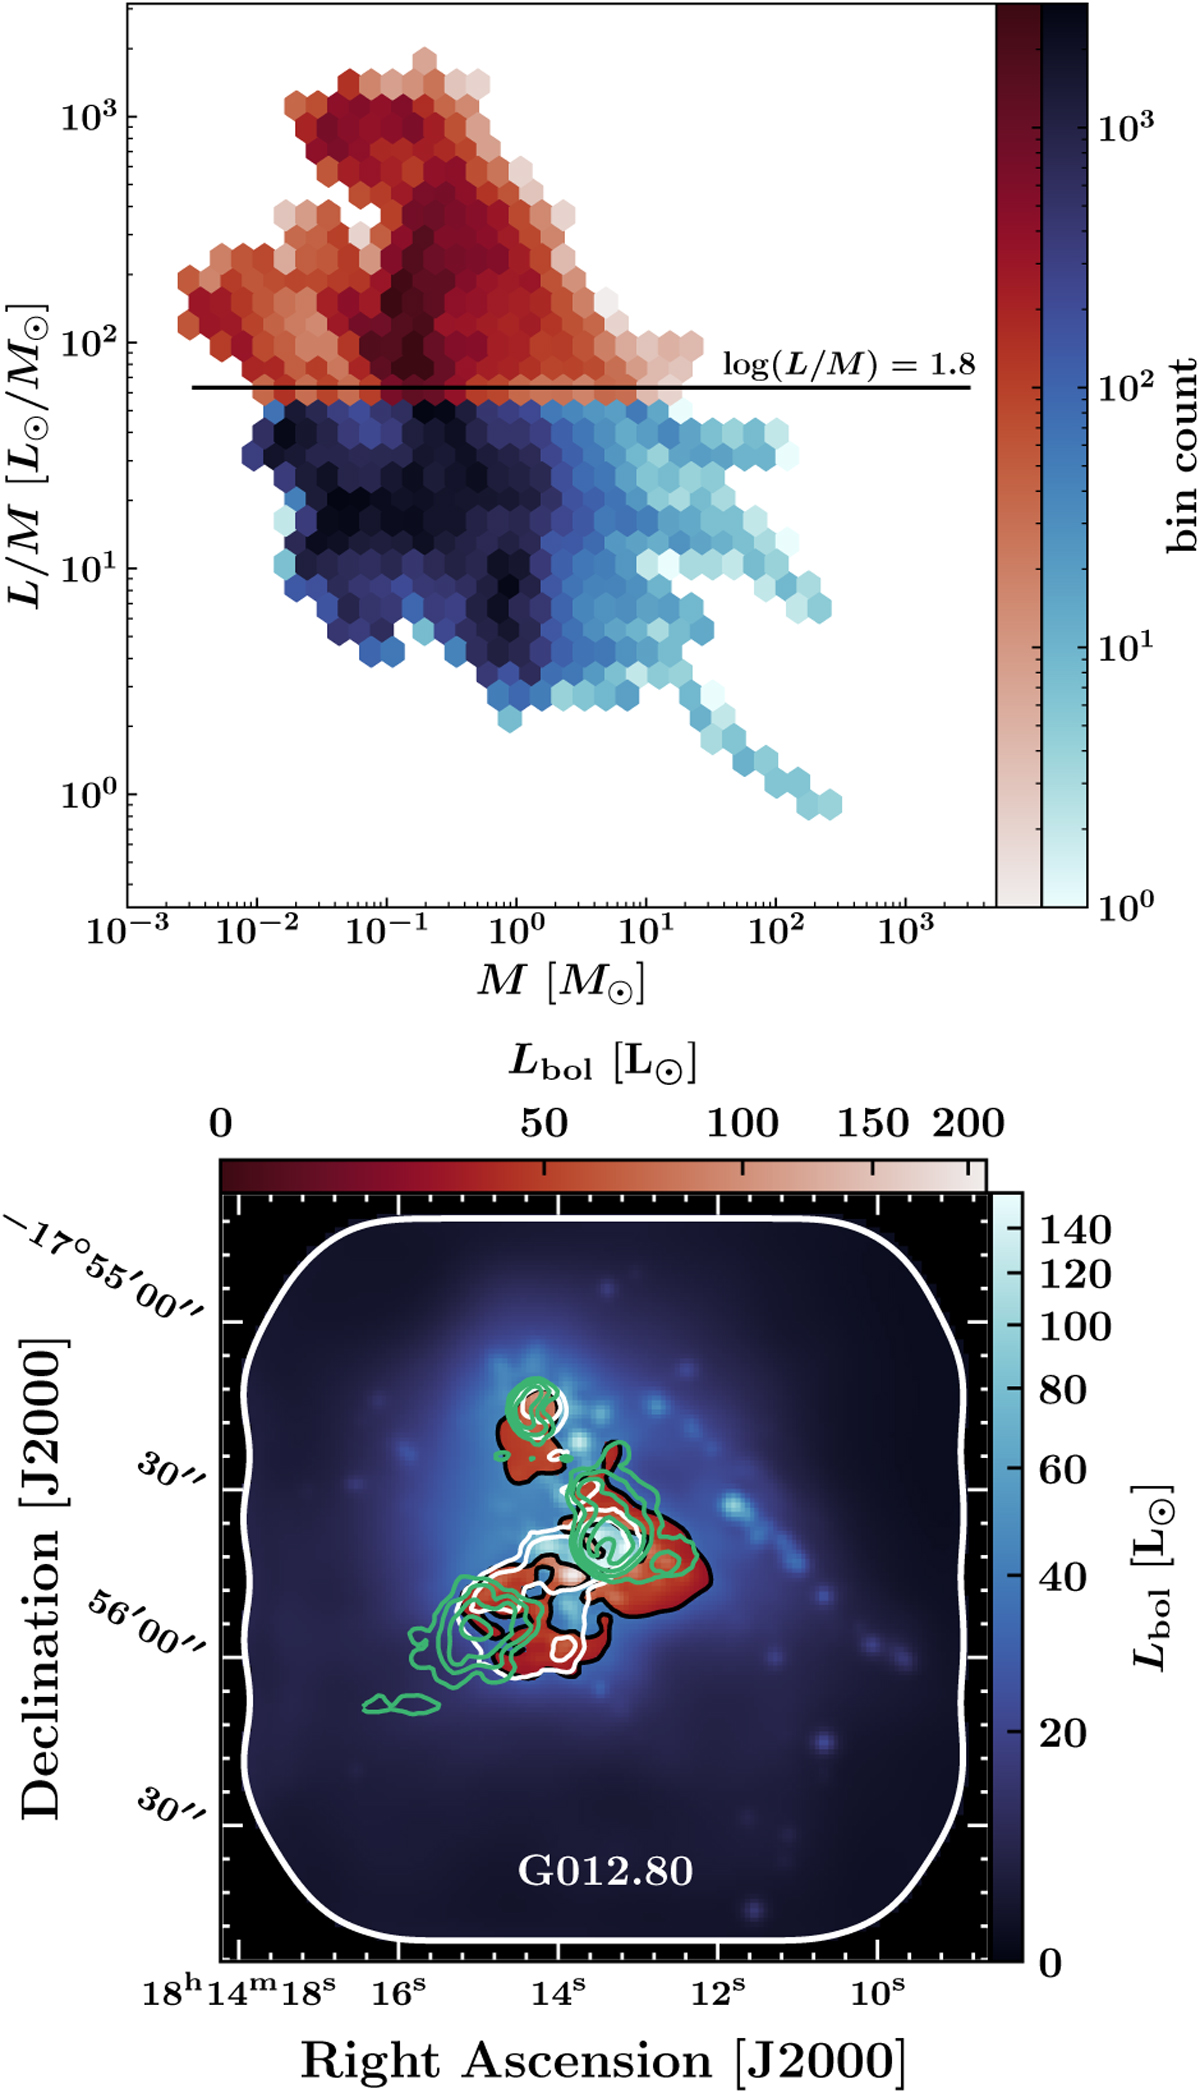
Luminosity-to-mass ratio unveiled by PPMAP. Top panel: we show the complete histogram of L/M across the 15 ALMA-IMF regions studied, separated into two samples by the equation log(L/M) = 1.8. Bottom panel: as an example, a decomposition of the evolved G012.80 protocluster’s luminosity map is performed. Pixels with higher luminosity-to-mass ratio (log(L/M) ≥ 1.8 are plotted with a red col-ormap, while their counterpart (log(L/M) ≤ 1.8) are shown with a blue colormap. Superimposed white contours illustrate the H41α line emission, that traces regions dominated by free-free emission (contour levels: logarithmically spaced between 0.025 and 0.075 Jy beam−1). Green contours illustrate the NeII line emission (contour levels: logarithmically spaced between 0.005 and 0.04 erg s−1 cm−2 sr−1).
Current usage metrics show cumulative count of Article Views (full-text article views including HTML views, PDF and ePub downloads, according to the available data) and Abstracts Views on Vision4Press platform.
Data correspond to usage on the plateform after 2015. The current usage metrics is available 48-96 hours after online publication and is updated daily on week days.
Initial download of the metrics may take a while.