Fig. 11
Download original image
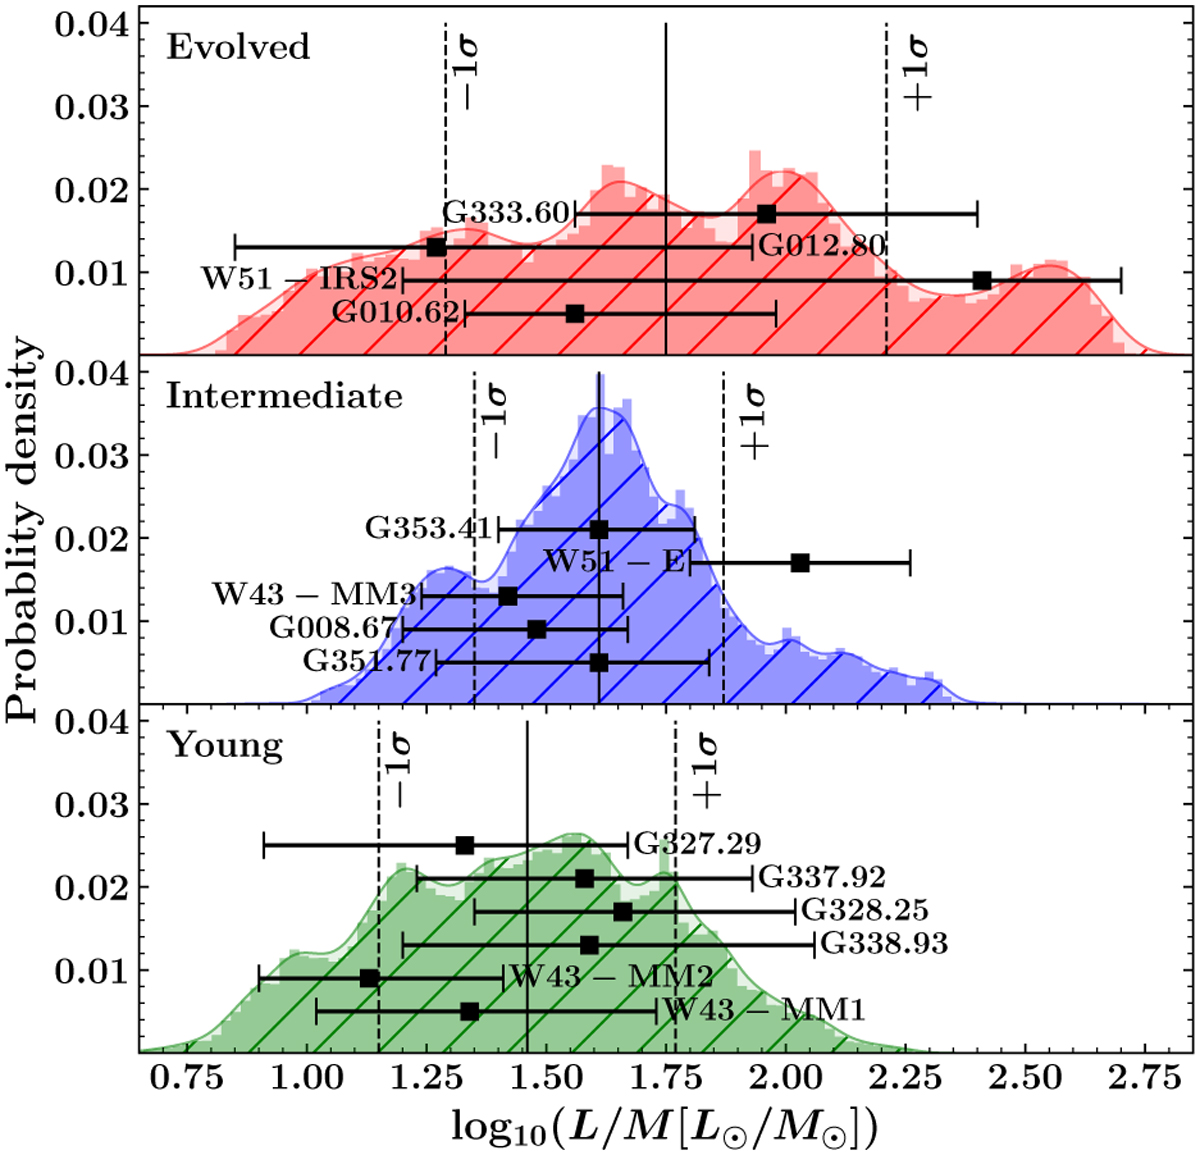
Probability density functions (PDFs) of the luminosity-to-mass ratio, normalized with respect to the area. Cumulative PDFs are shown for the evolved (top panel: G010.62, W51-IRS2, G012.80, G333.60), intermediate (central panel: G351.77, G008.67, W43-MM3, W51-E, G353.41) and young (bottom: W43-MM1, W43-MM2, G338.93, G328.25, G337.92, G327.29) protoclusters. Black markers and horizontal bars represent the median, first and last decile L/M measurements within individual protoclusters.
Current usage metrics show cumulative count of Article Views (full-text article views including HTML views, PDF and ePub downloads, according to the available data) and Abstracts Views on Vision4Press platform.
Data correspond to usage on the plateform after 2015. The current usage metrics is available 48-96 hours after online publication and is updated daily on week days.
Initial download of the metrics may take a while.