Fig. 1
Download original image
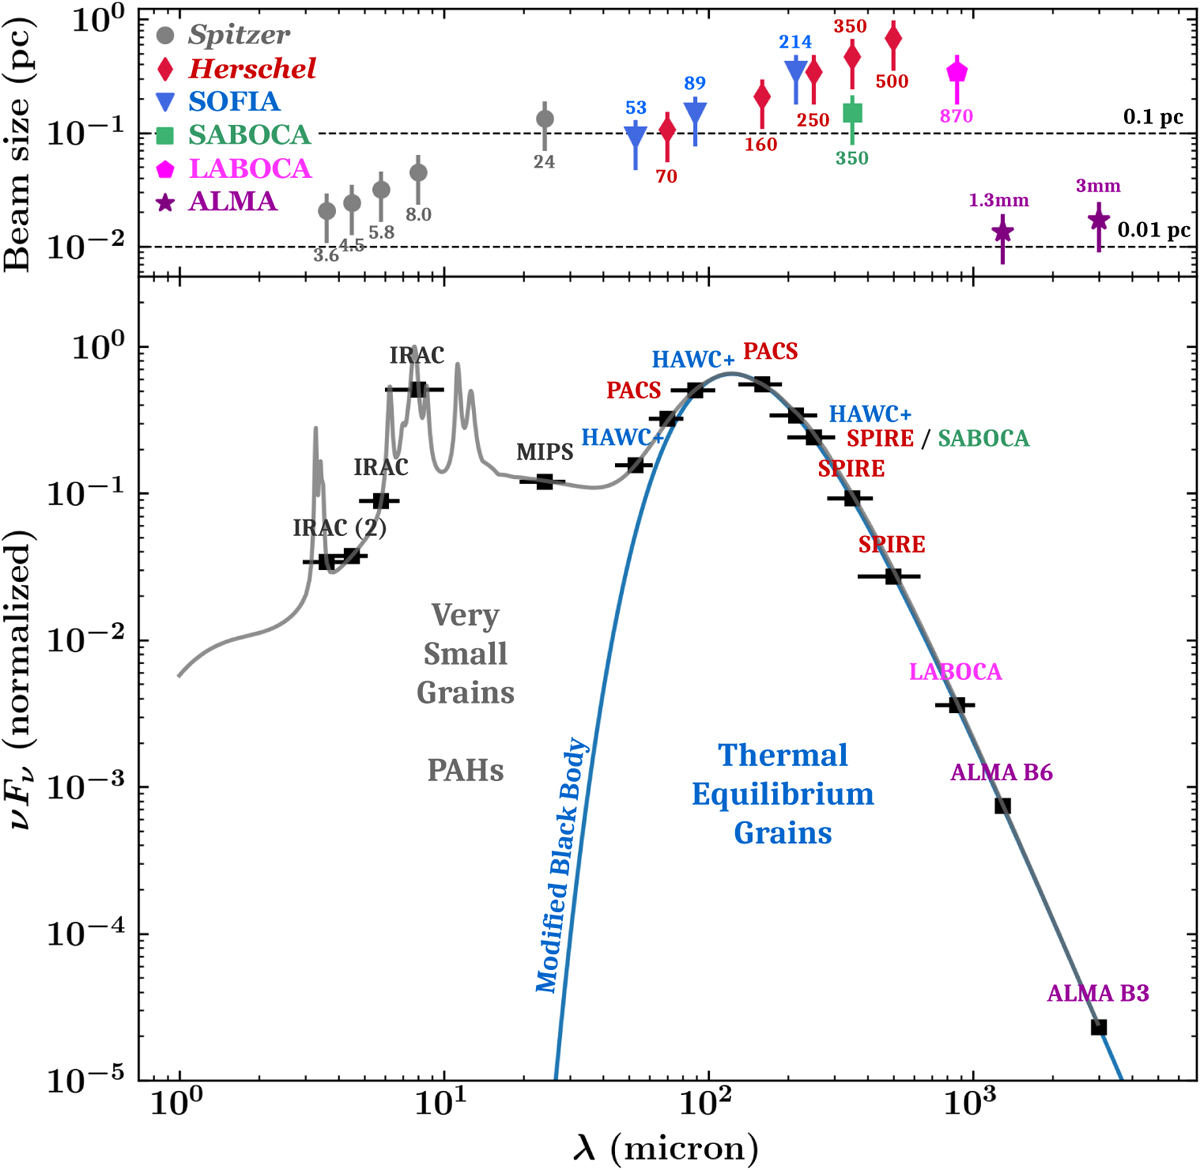
Observational constraints. Bottom panel: illustrative spectral energy distribution (SED), produced using a THEMIS grain mixture (Jones et al. 2017, gray curve). The blue curve represents a single modified blackbody that best fits the far-infrared and millimeter range of the SED. Black markers are overlaid on the gray curve to indicate the SED coverage enabled by the observations listed in Table 1, with the horizontal bars representing the bandwidths. Top panel: beam size of the observations used in our analysis, with the wavelength of the observations indicated on top of each marker (in micron, except for ALMA markers). Vertical bars represent the distance-induced variation in physical beam size across the ALMA-IMF sample.
Current usage metrics show cumulative count of Article Views (full-text article views including HTML views, PDF and ePub downloads, according to the available data) and Abstracts Views on Vision4Press platform.
Data correspond to usage on the plateform after 2015. The current usage metrics is available 48-96 hours after online publication and is updated daily on week days.
Initial download of the metrics may take a while.