Open Access
Fig. 8
Download original image
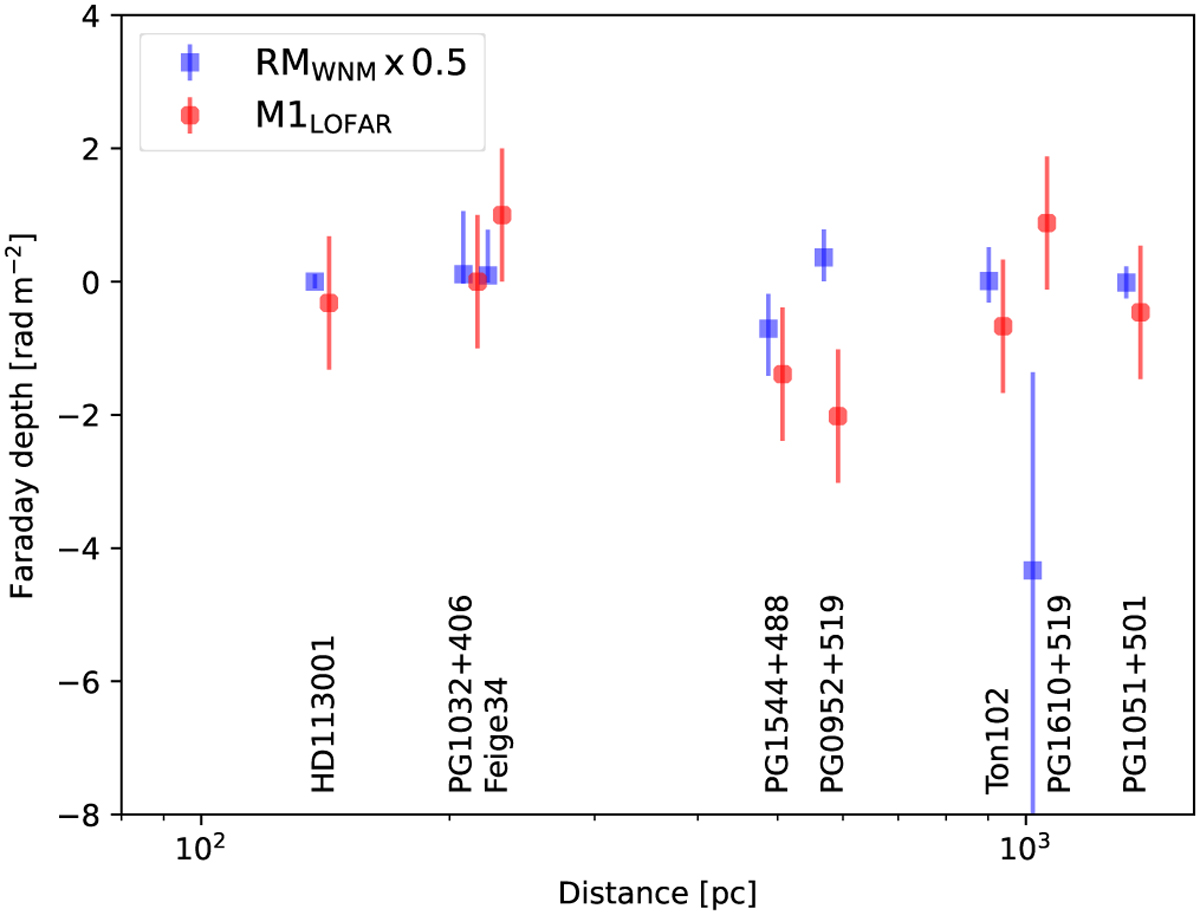
Comparison of the WNM RMs with the first moments of the LOFAR Faraday spectra for each star individually. The values of RMWNM × 0.5 are plotted with blue squares, and the intensity weighted Faraday depths from LOFAR, M1LOFAR, with red circles.
Current usage metrics show cumulative count of Article Views (full-text article views including HTML views, PDF and ePub downloads, according to the available data) and Abstracts Views on Vision4Press platform.
Data correspond to usage on the plateform after 2015. The current usage metrics is available 48-96 hours after online publication and is updated daily on week days.
Initial download of the metrics may take a while.