Open Access
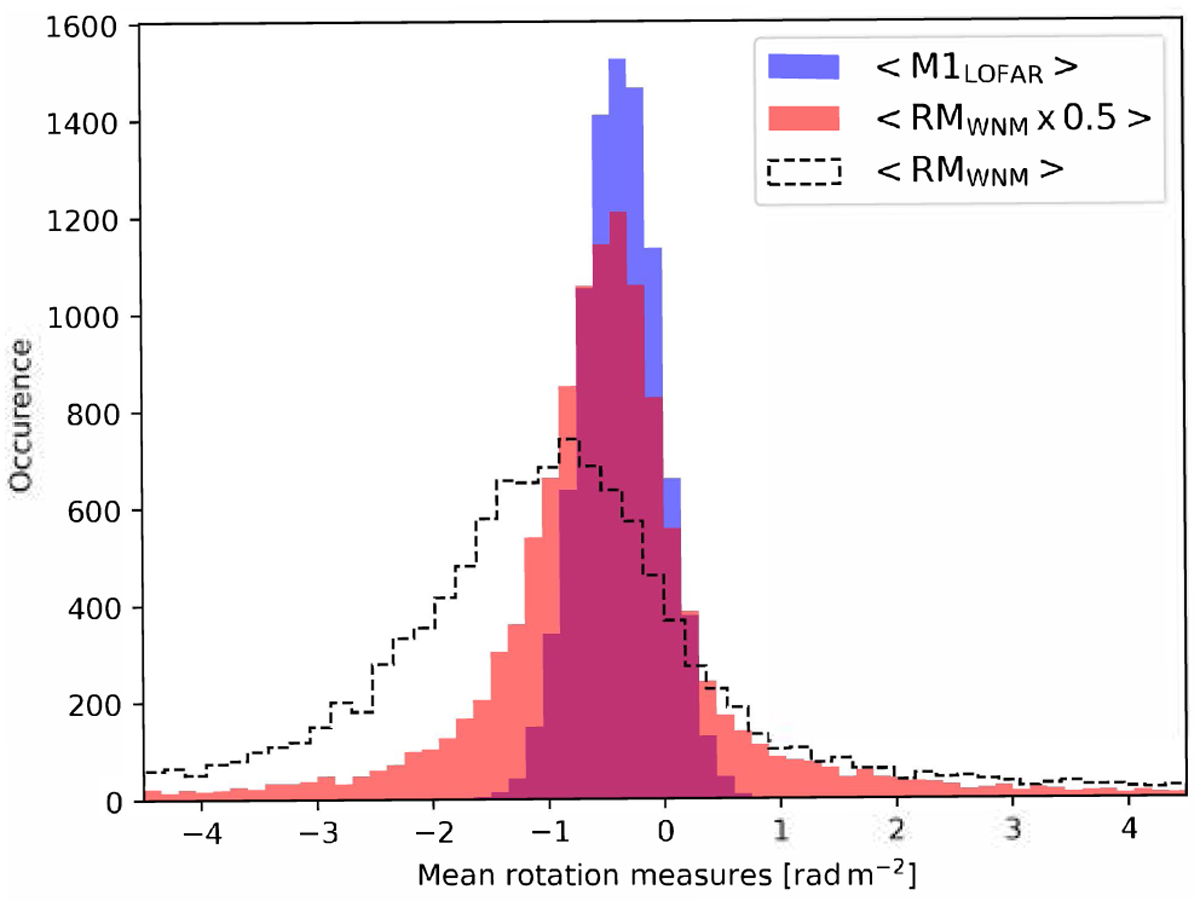
Fig. 7
Download original image
PDFs of the mean RM and the mean LOFAR M1 moment. The plot displays the PDFs of ⟨RMWNM × 0.5⟩ (red) and ⟨M 1LOFAR⟩ (blue). The PDF of ⟨RMWNM⟩ is also shown as a black line. The mean values are computed over the eight stars with both UV and LOFAR data.
Current usage metrics show cumulative count of Article Views (full-text article views including HTML views, PDF and ePub downloads, according to the available data) and Abstracts Views on Vision4Press platform.
Data correspond to usage on the plateform after 2015. The current usage metrics is available 48-96 hours after online publication and is updated daily on week days.
Initial download of the metrics may take a while.