Fig. 5
Download original image
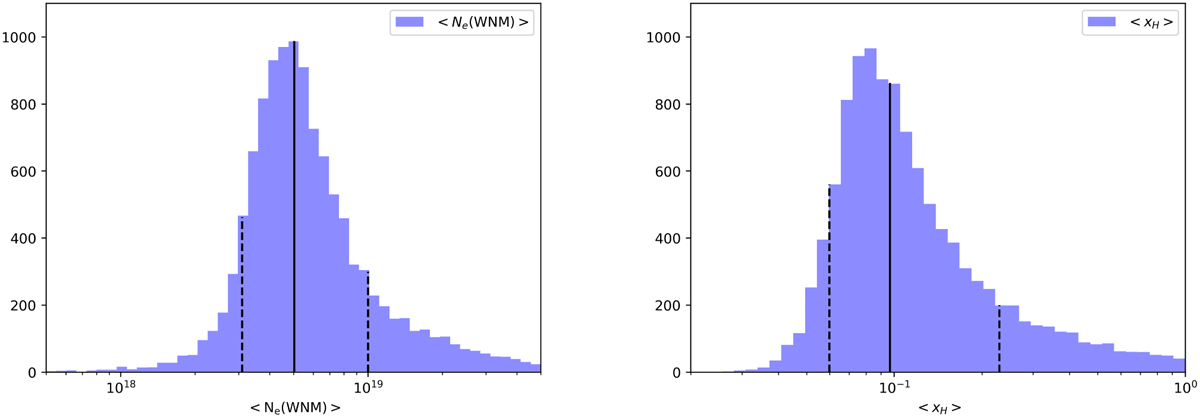
Probability distribution of the mean value of the electron column density (left) and ionization fraction (right). The histograms are built averaging the samples of the posterior distributions over the 9 stars in our sample more distant than 100 pc (i.e. excluding HZ43A). The solid black lines indicate the median value and the dashed lines the 16% and 84% percentiles.
Current usage metrics show cumulative count of Article Views (full-text article views including HTML views, PDF and ePub downloads, according to the available data) and Abstracts Views on Vision4Press platform.
Data correspond to usage on the plateform after 2015. The current usage metrics is available 48-96 hours after online publication and is updated daily on week days.
Initial download of the metrics may take a while.