Fig. 3
Download original image
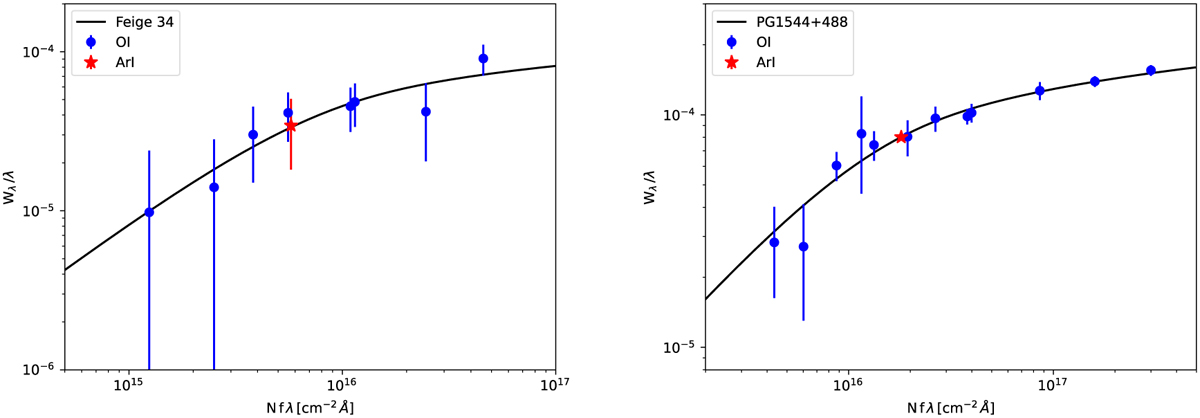
Curves of growth for the two stars Feige 34 (left) and PG1544+488 (right), chosen as examples of low and high column densities. For each graph, the y-axis represents the ratio between the equivalent width, Wλ, and the wavelength, λ, of the line, and the x-axis the product of the column density N expressed in cm−2, the strength of the transition (unit-less f-value), and λ in Å. The blue circles represent the equivalent widths of the O Ilines used to determine the column density of OI and the Doppler parameter, b, and the red star the equivalent width of the Ar I line used to determine the [Ar I/O I] abundance ratio.
Current usage metrics show cumulative count of Article Views (full-text article views including HTML views, PDF and ePub downloads, according to the available data) and Abstracts Views on Vision4Press platform.
Data correspond to usage on the plateform after 2015. The current usage metrics is available 48-96 hours after online publication and is updated daily on week days.
Initial download of the metrics may take a while.