Fig. 2
Download original image
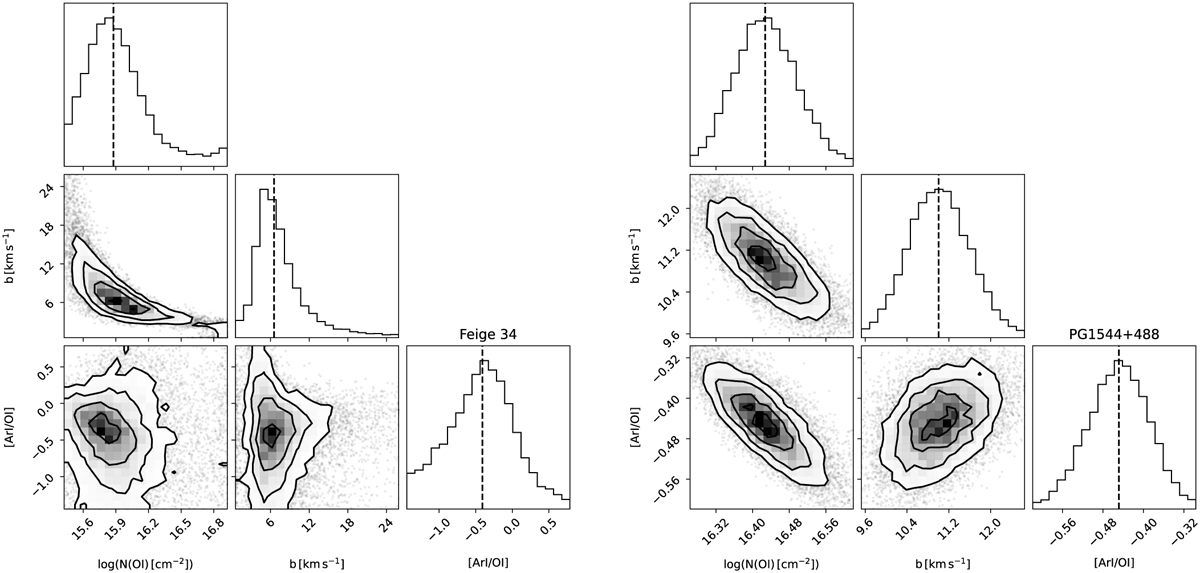
Corner plots of MCMC data fit for two stars in our sample Feige 34 (left) and PG1544+488 (right), chosen as examples of low and high column densities. The histograms show the probability distribution of the three model parameters, and the contours display their interdependence. The dashed lines plotted over the histograms represent the median values of the model parameters.
Current usage metrics show cumulative count of Article Views (full-text article views including HTML views, PDF and ePub downloads, according to the available data) and Abstracts Views on Vision4Press platform.
Data correspond to usage on the plateform after 2015. The current usage metrics is available 48-96 hours after online publication and is updated daily on week days.
Initial download of the metrics may take a while.