Open Access
Fig. 1
Download original image
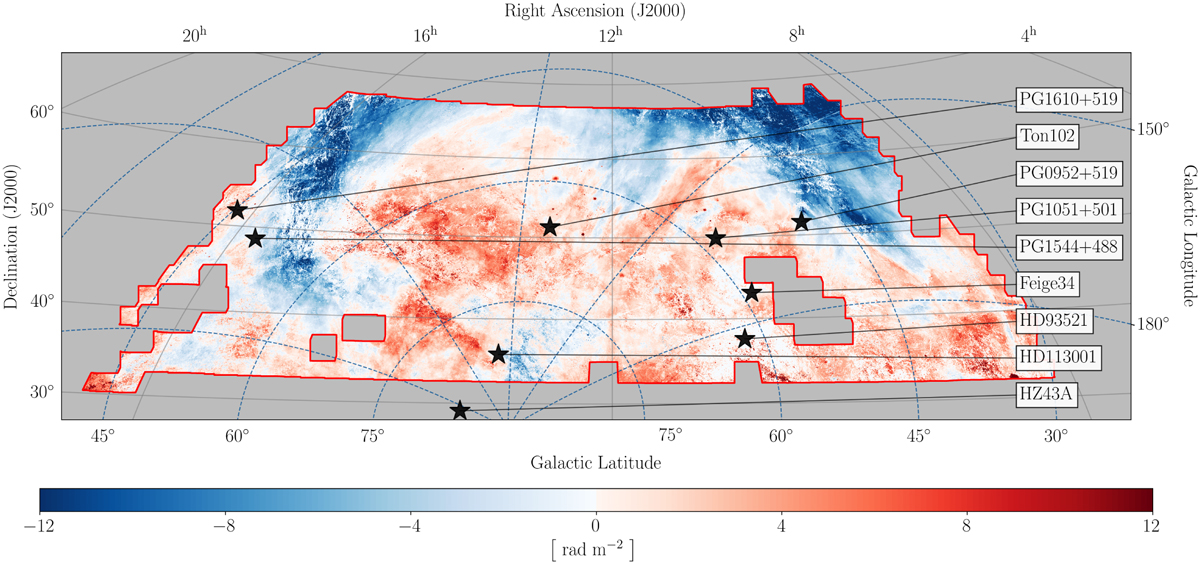
Stars in our sample overlaid on a LOFAR image of the LoTSS field from Erceg et al. (2022). The image displays the first moment of the Faraday spectra in units of rad m−2. Celestial and Galactic coordinates are plotted with solid and dashed lines, respectively.
Current usage metrics show cumulative count of Article Views (full-text article views including HTML views, PDF and ePub downloads, according to the available data) and Abstracts Views on Vision4Press platform.
Data correspond to usage on the plateform after 2015. The current usage metrics is available 48-96 hours after online publication and is updated daily on week days.
Initial download of the metrics may take a while.