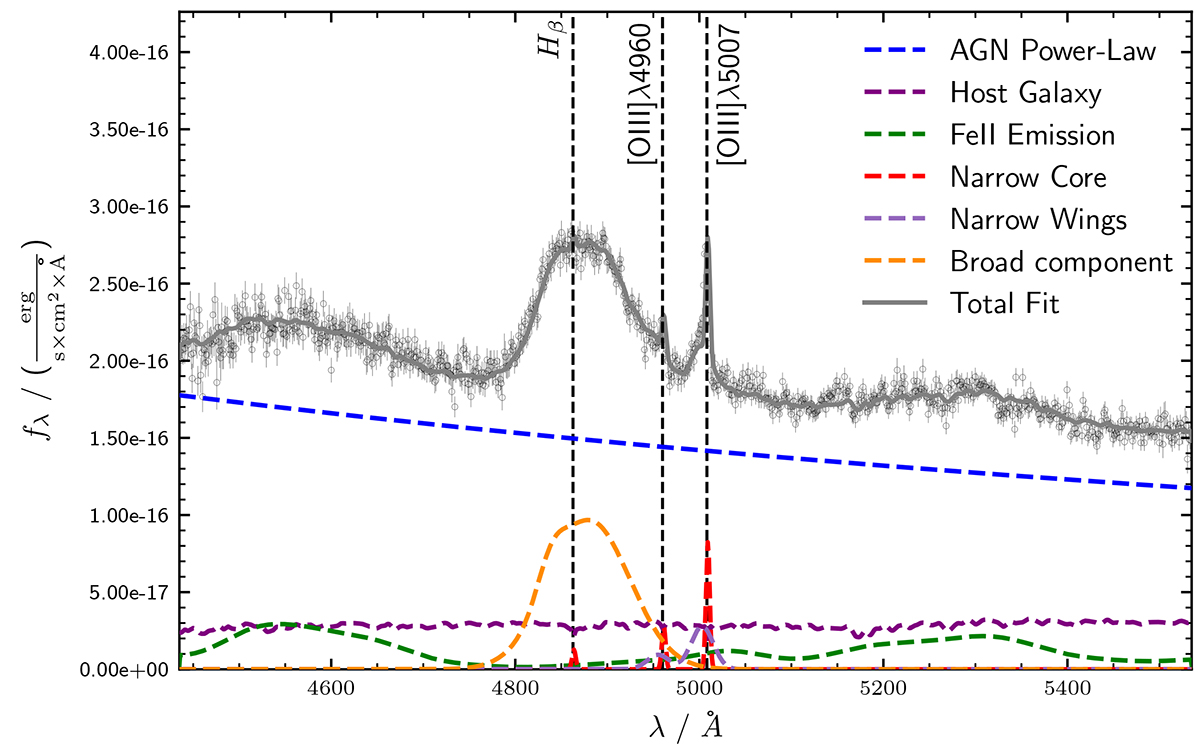
Fig. A.2.
Download original image
Example of the spectral fitting in the Hβ region. The AGN dominates the continuum, and a strong broad component of Hβ modelled with two Gaussian components is detected. The additional component of the narrow emission line is labelled as ‘Narrow Wings’. The plot corresponds to a 1.0 AGN. Wavelength is represented in rest-frame.
Current usage metrics show cumulative count of Article Views (full-text article views including HTML views, PDF and ePub downloads, according to the available data) and Abstracts Views on Vision4Press platform.
Data correspond to usage on the plateform after 2015. The current usage metrics is available 48-96 hours after online publication and is updated daily on week days.
Initial download of the metrics may take a while.