Fig. 9.
Download original image
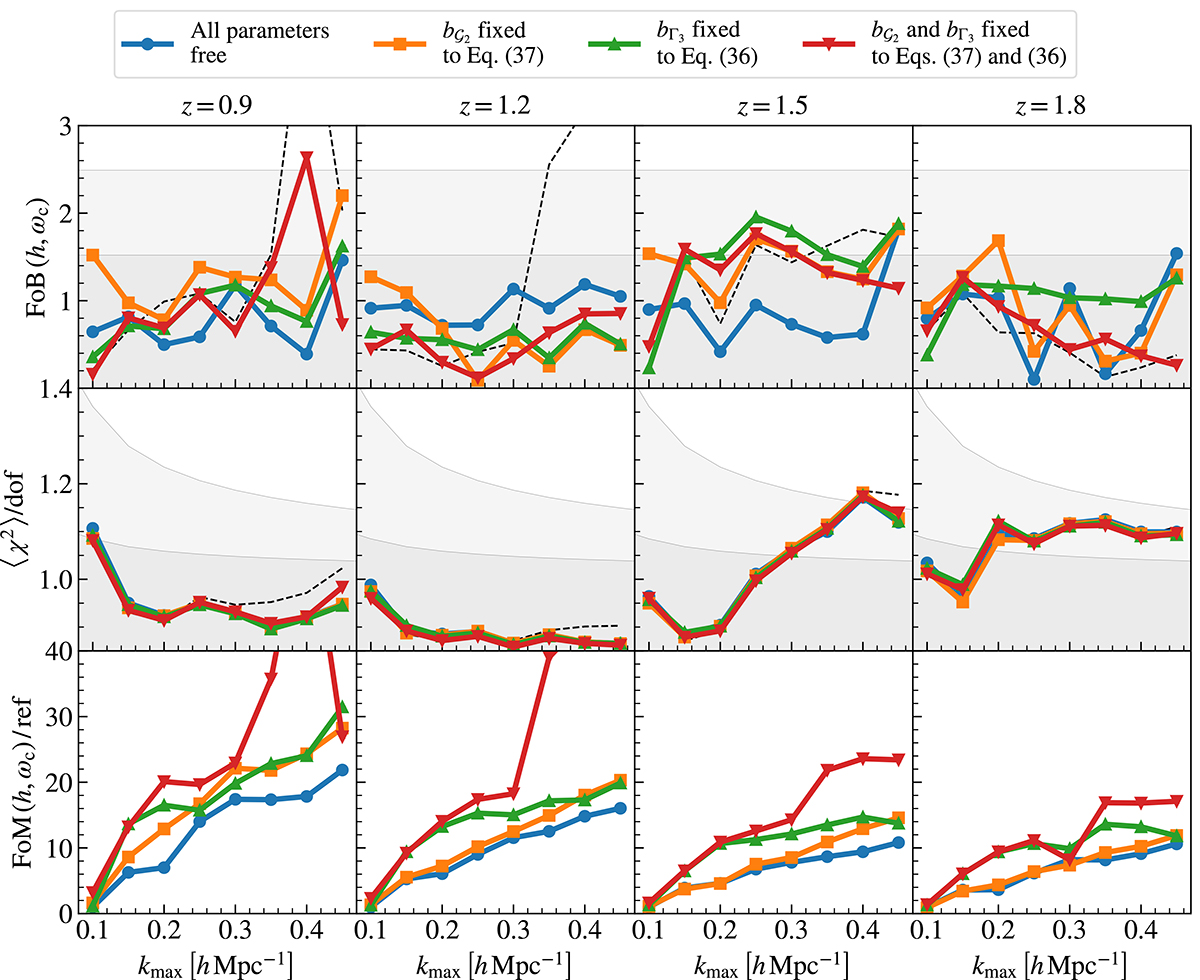
Performance metrics of the Model 1 HOD samples for the various configurations defined in Sect. 5.2 as a function of the maximum wave mode kmax, and for the four different redshifts of the samples. The metrics shown are figure of bias (top), goodness of fit (middle), and figure of merit (bottom). Different colours correspond to different model configurations, as listed in the legend. The black dashed line shows as a reference the case in which both tidal bias parameters, ![]() and bΓ3, are set to 0. The grey bands in the FoB and χ2 panels represent the 68% and 95% percentiles of the corresponding distributions. The FoM panels show the figure of merit normalised to the one of the standard run – with all bias parameters free to vary – at kmax = 0.1 h Mpc−1.
and bΓ3, are set to 0. The grey bands in the FoB and χ2 panels represent the 68% and 95% percentiles of the corresponding distributions. The FoM panels show the figure of merit normalised to the one of the standard run – with all bias parameters free to vary – at kmax = 0.1 h Mpc−1.
Current usage metrics show cumulative count of Article Views (full-text article views including HTML views, PDF and ePub downloads, according to the available data) and Abstracts Views on Vision4Press platform.
Data correspond to usage on the plateform after 2015. The current usage metrics is available 48-96 hours after online publication and is updated daily on week days.
Initial download of the metrics may take a while.