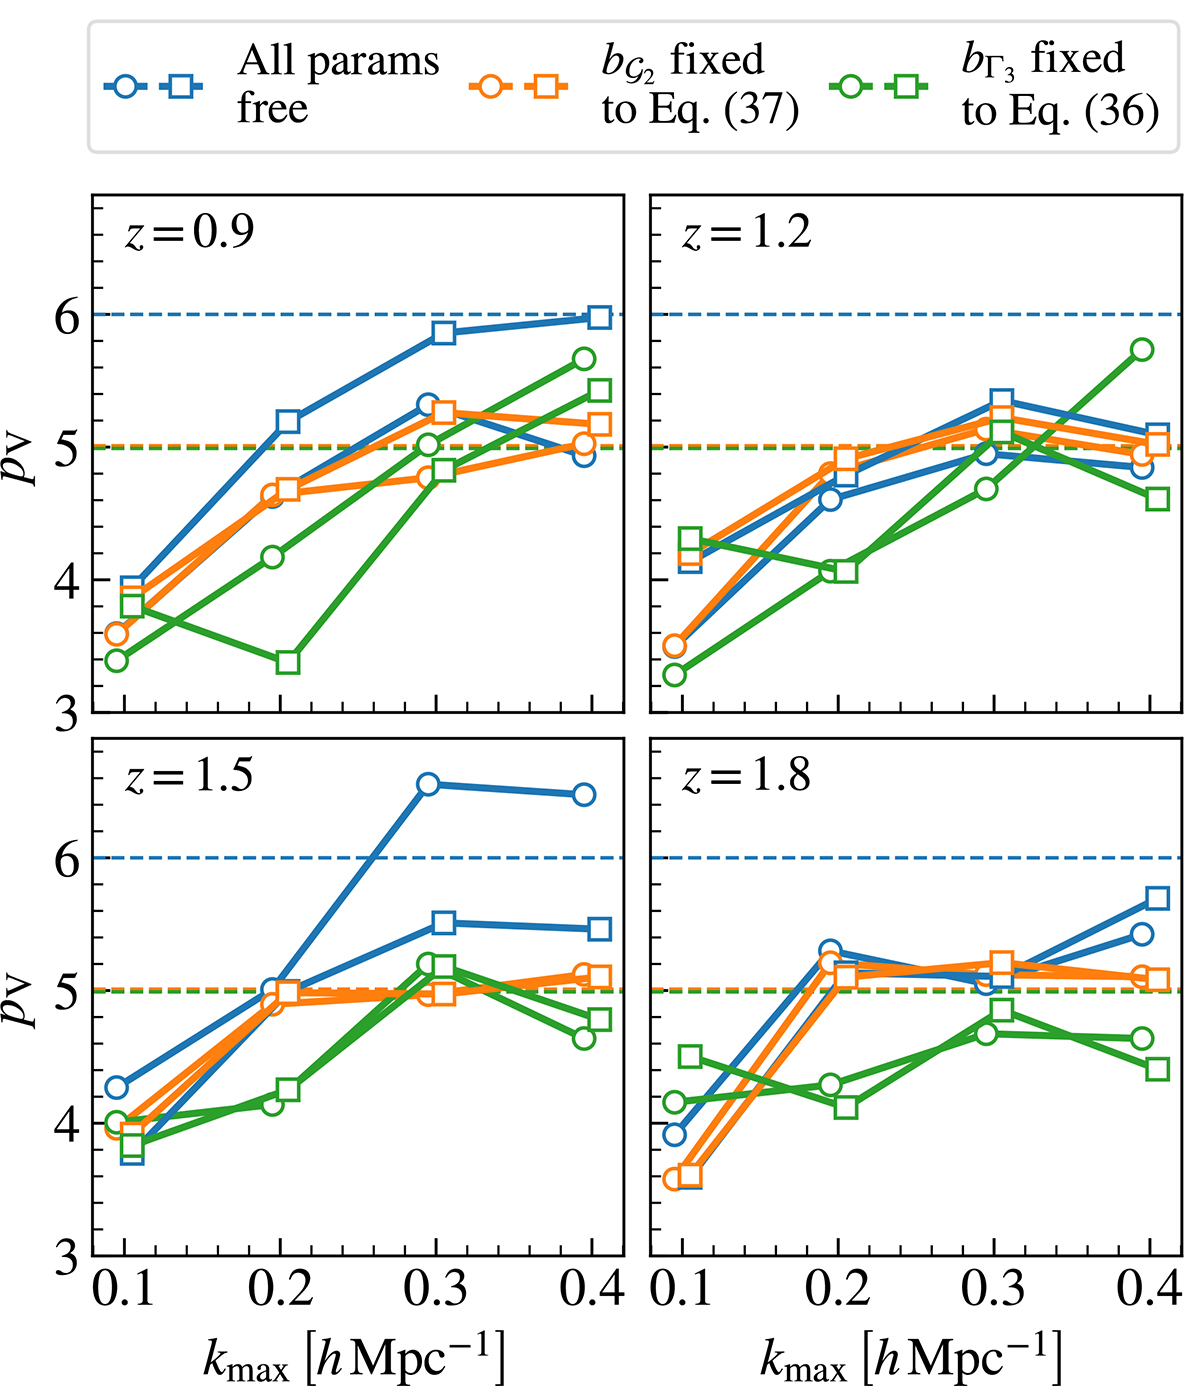
Fig. 7.
Download original image
Number of effective parameters that can be properly constrained by the input data vectors of the Model 1 (circles) and 3 (squares) HOD samples, respectively, as a function of the maximum wave mode included in the analysis and for different configurations of the bias model, as listed in the legend. Different panels correspond to different redshifts, as shown in the corresponding top left corner.
Current usage metrics show cumulative count of Article Views (full-text article views including HTML views, PDF and ePub downloads, according to the available data) and Abstracts Views on Vision4Press platform.
Data correspond to usage on the plateform after 2015. The current usage metrics is available 48-96 hours after online publication and is updated daily on week days.
Initial download of the metrics may take a while.