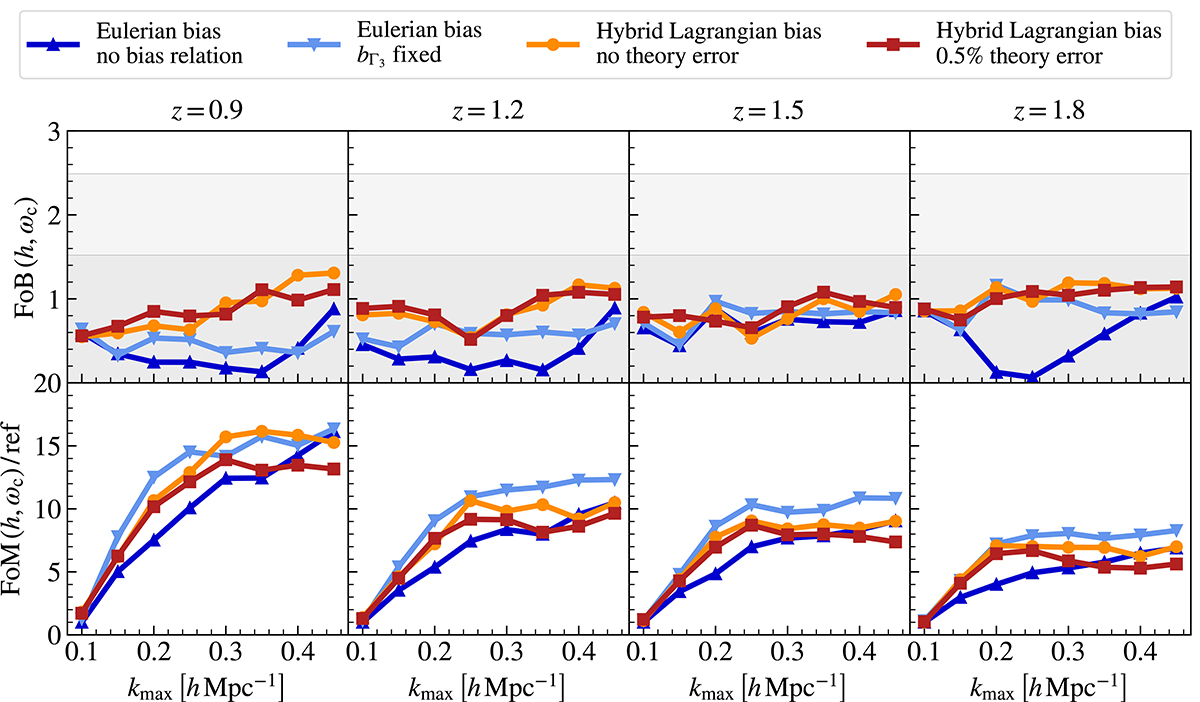
Fig. 3.
Download original image
Performance metrics (FoB in the top row and FoM in the bottom row) extracted from the Model 3 HOD samples as a function of the maximum wave mode kmax of the fit, assuming the rescaled covariance matrices matching the four Euclid spectroscopic redshift bins described in Sect. 2.3. Different curves correspond to different models, as described in the legend. The FoM panels are normalised in units of the reference FoM, corresponding to the one of the EFT model with all parameters free at kmax = 0.1 h Mpc−1. The grey bands in the FoB panels represent the 68% and 95% percentiles of the corresponding FoB distribution, as explained in Sect. 4.1.1.
Current usage metrics show cumulative count of Article Views (full-text article views including HTML views, PDF and ePub downloads, according to the available data) and Abstracts Views on Vision4Press platform.
Data correspond to usage on the plateform after 2015. The current usage metrics is available 48-96 hours after online publication and is updated daily on week days.
Initial download of the metrics may take a while.