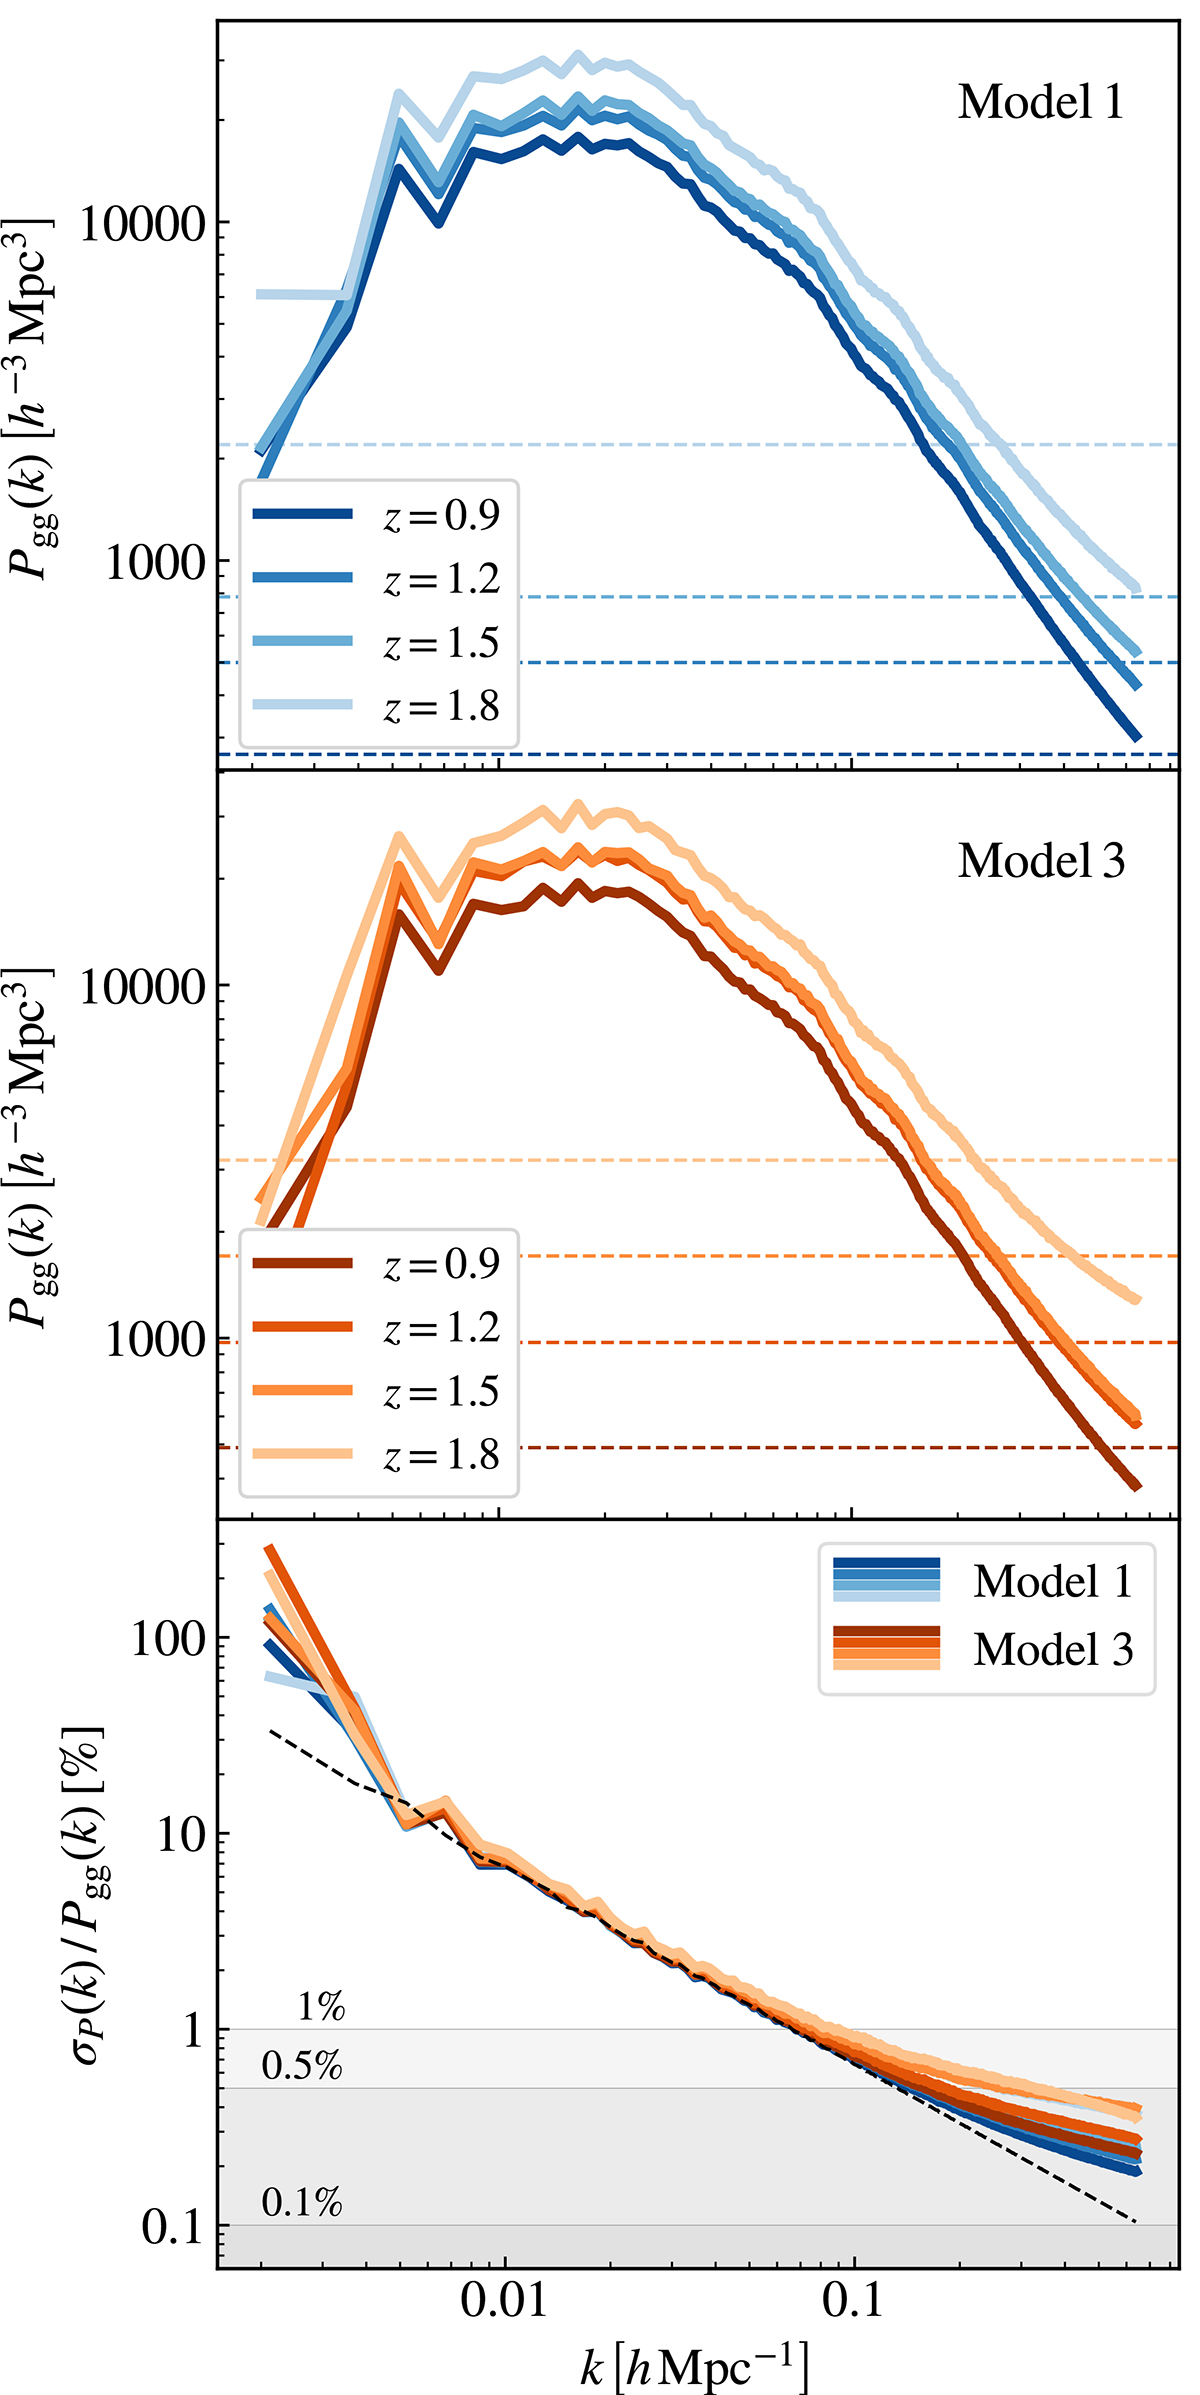
Fig. 2.
Download original image
Galaxy power spectrum measurements and uncertainties obtained from the Flagship I comoving snapshots. Top: measurements of the Model 1 HOD samples. The colour gradient identifies the different redshifts of the samples, as shown in the legend. Dashed horizontal lines correspond to the amplitude of the Poisson shot-noise term Psn – obtained as the inverse of the number density specified in the last column of Table 2 – for the different redshifts. Centre: same but for the Model 3 HOD samples. Bottom: error-to-measurement ratios, assuming a Gaussian covariance matrix as in Eq. (3). The coloured solid lines are obtained using the Poisson noise-subtracted power spectra, while the dashed black line highlights the linear relationship from Eq. (3), i.e. 2/Nk. Grey bands mark the 1%, 0.5%, and 0.1% limit.
Current usage metrics show cumulative count of Article Views (full-text article views including HTML views, PDF and ePub downloads, according to the available data) and Abstracts Views on Vision4Press platform.
Data correspond to usage on the plateform after 2015. The current usage metrics is available 48-96 hours after online publication and is updated daily on week days.
Initial download of the metrics may take a while.