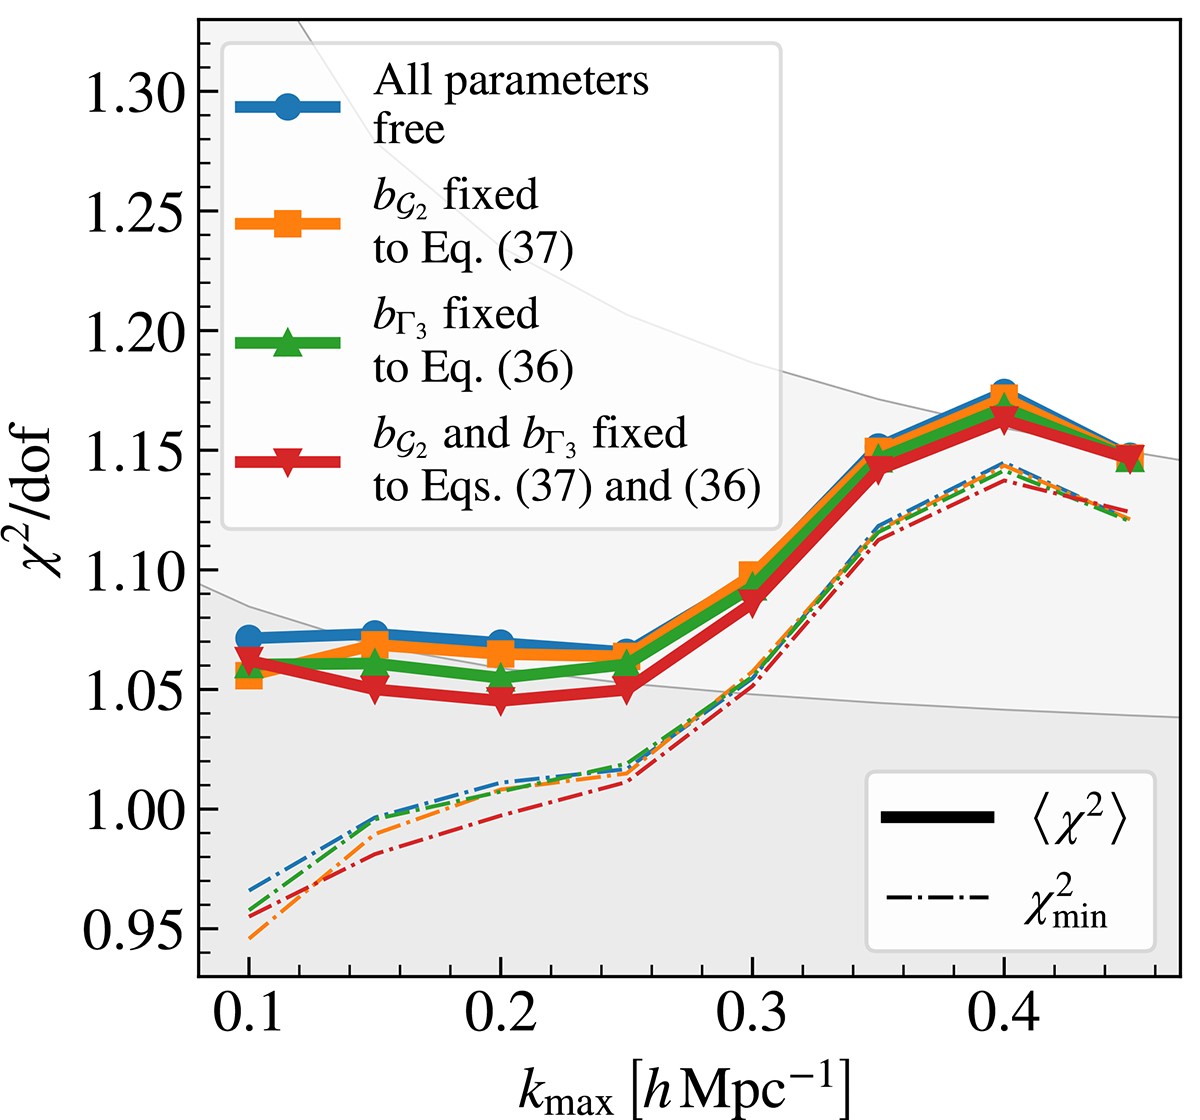
Fig. E.1.
Download original image
Normalised χ2 values for the Model 3 sample at z = 1.2. Solid and dot-dashed lines corresponds to the posterior-averaged and minimum χ2, respectively. Different colours represent different bias modelling assumtpions, as listed in the legend. The two grey shaded areas represent the 68% and 95% of the χ2 distribution with the same number of degrees of freedom of the considered model.
Current usage metrics show cumulative count of Article Views (full-text article views including HTML views, PDF and ePub downloads, according to the available data) and Abstracts Views on Vision4Press platform.
Data correspond to usage on the plateform after 2015. The current usage metrics is available 48-96 hours after online publication and is updated daily on week days.
Initial download of the metrics may take a while.