Fig. C.1.
Download original image
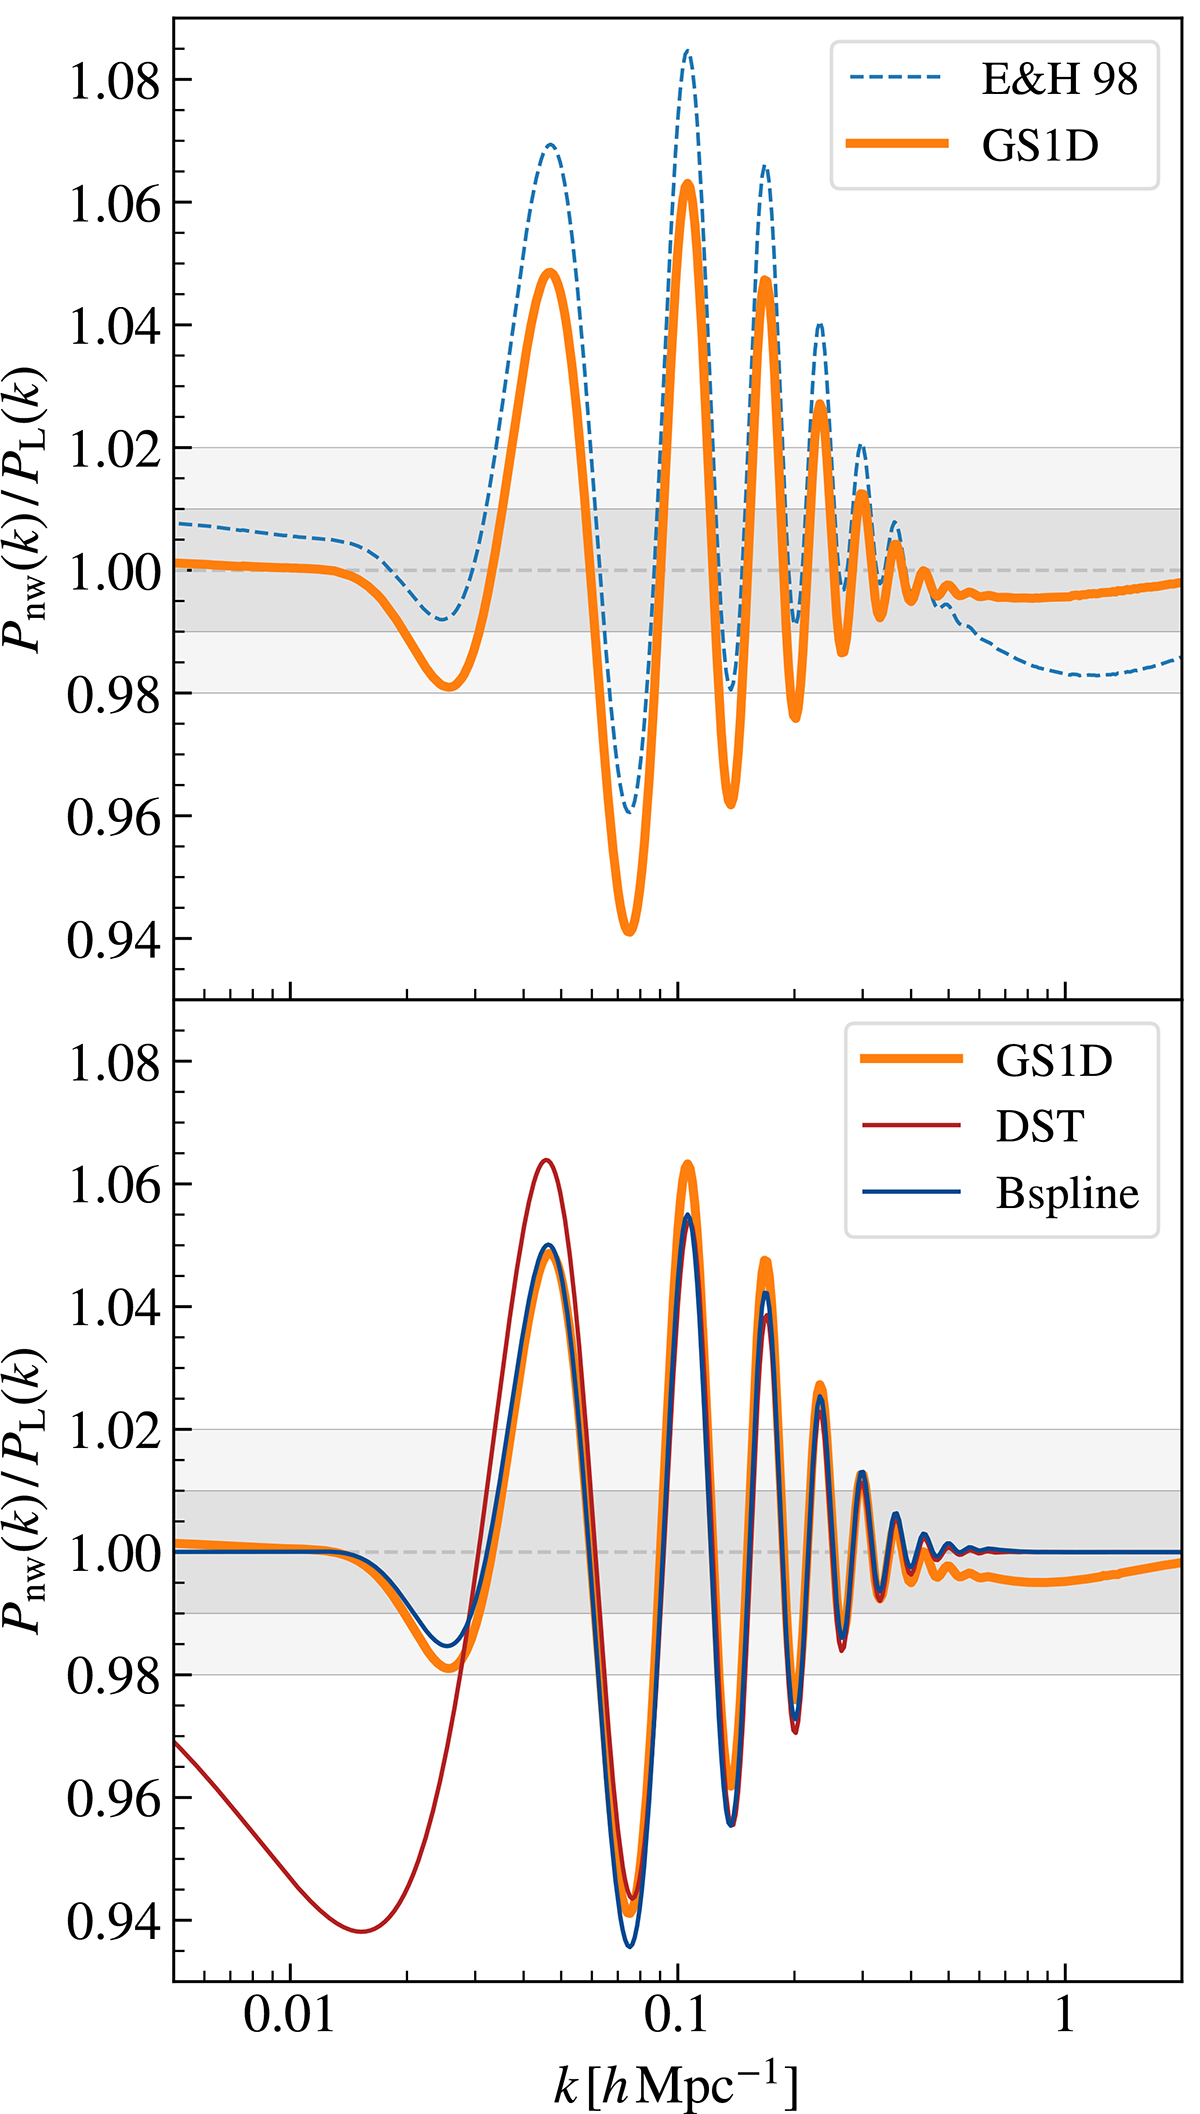
Ratio between the no-wiggle and the linear matter power spectrum. Top: Comparison between the raw featureless power spectrum PEH and the no-wiggle power spectrum Pnw computed using Eq. (C.1). In both cases, the power spectra are computed at z = 0 using the fiducial cosmology from Table 1. Bottom: Comparison between the three different methods we tested to obtain the no-wiggle power spectrum Pnw. The thick orange line corresponds to the method we selected, i.e. the convolution with a Gaussian smoothing function, while the other two lines represent a Discrete Sine Transform (red) and a basis spline (blue). In both panels, the grey shaded bands represent the 1% (dark grey) and 2% (light grey) thresholds.
Current usage metrics show cumulative count of Article Views (full-text article views including HTML views, PDF and ePub downloads, according to the available data) and Abstracts Views on Vision4Press platform.
Data correspond to usage on the plateform after 2015. The current usage metrics is available 48-96 hours after online publication and is updated daily on week days.
Initial download of the metrics may take a while.