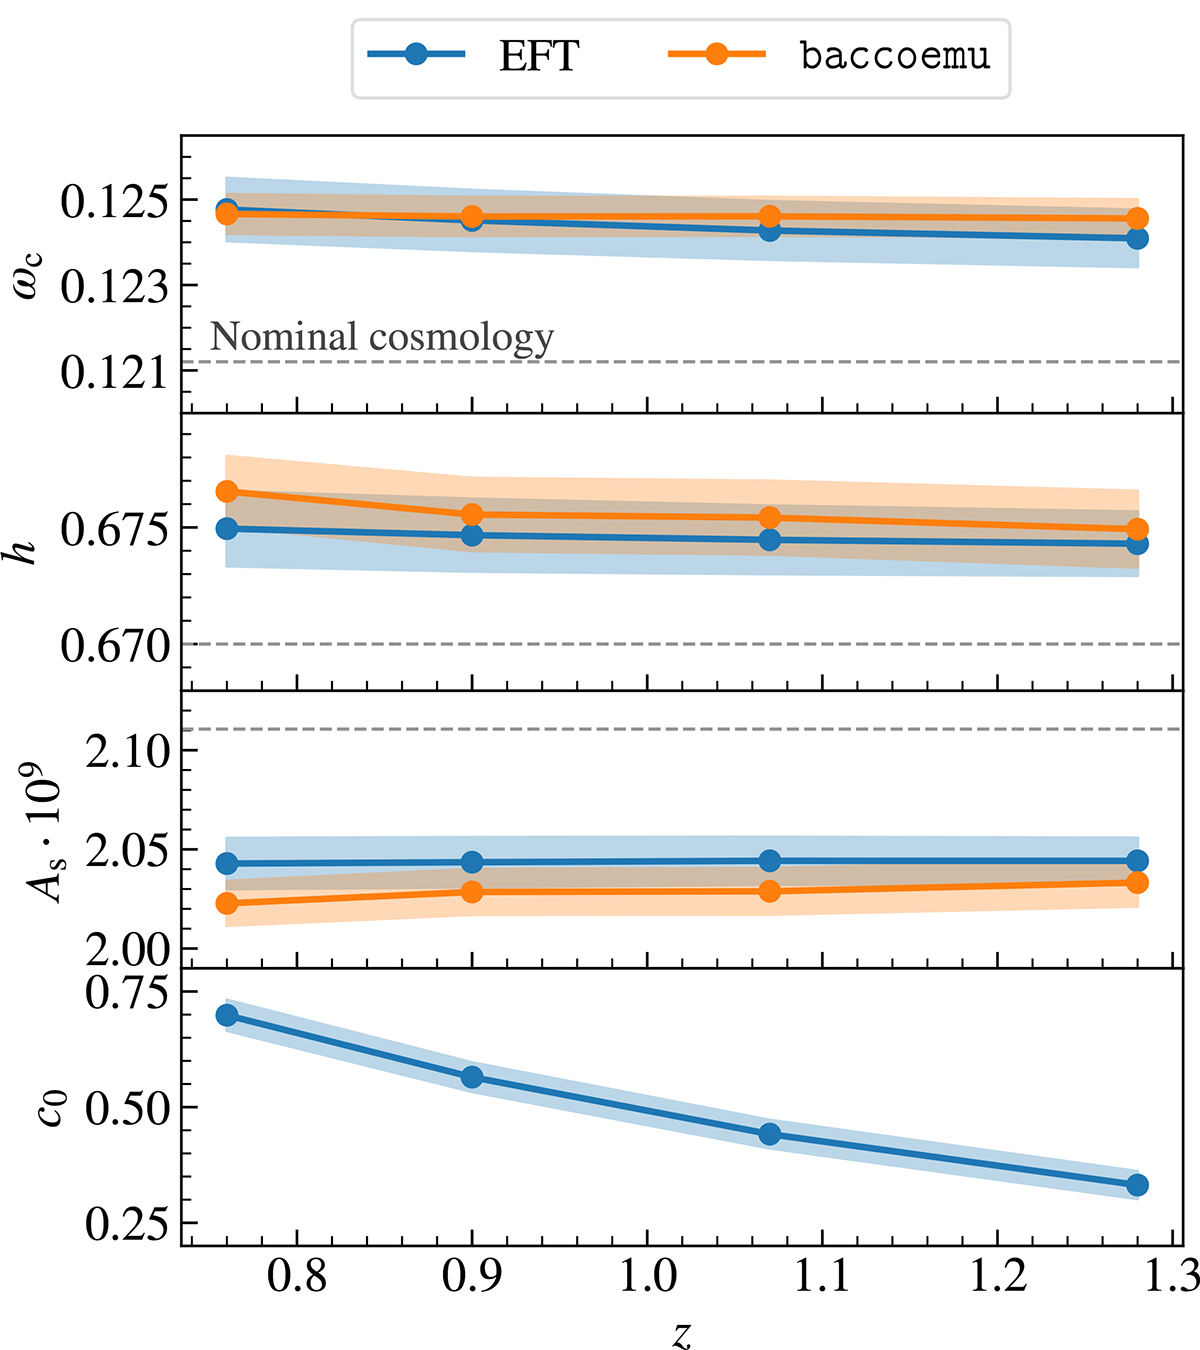
Fig. A.1.
Download original image
Marginalised one-dimensional constraints as a function of redshift obtained by fitting the measured matter power spectrum with the EFT model (blue) and the baccoemu emulator (orange). Solid lines and shaded bands mark the mean and the standard deviation of the posterior distribution, respectively. For both models, the fit is carried out up to maximum wave mode kmax = 0.25 h Mpc−1, using a Gaussian covariance matrix corresponding to the full box volume of the Flagship I simulation. Dashed lines denote the nominal fiducial values of the parameters {h,ωc,As}. In the bottom panel we show the marginalised constraints on the c0 EFT counterterm parameter.
Current usage metrics show cumulative count of Article Views (full-text article views including HTML views, PDF and ePub downloads, according to the available data) and Abstracts Views on Vision4Press platform.
Data correspond to usage on the plateform after 2015. The current usage metrics is available 48-96 hours after online publication and is updated daily on week days.
Initial download of the metrics may take a while.