Fig. 12.
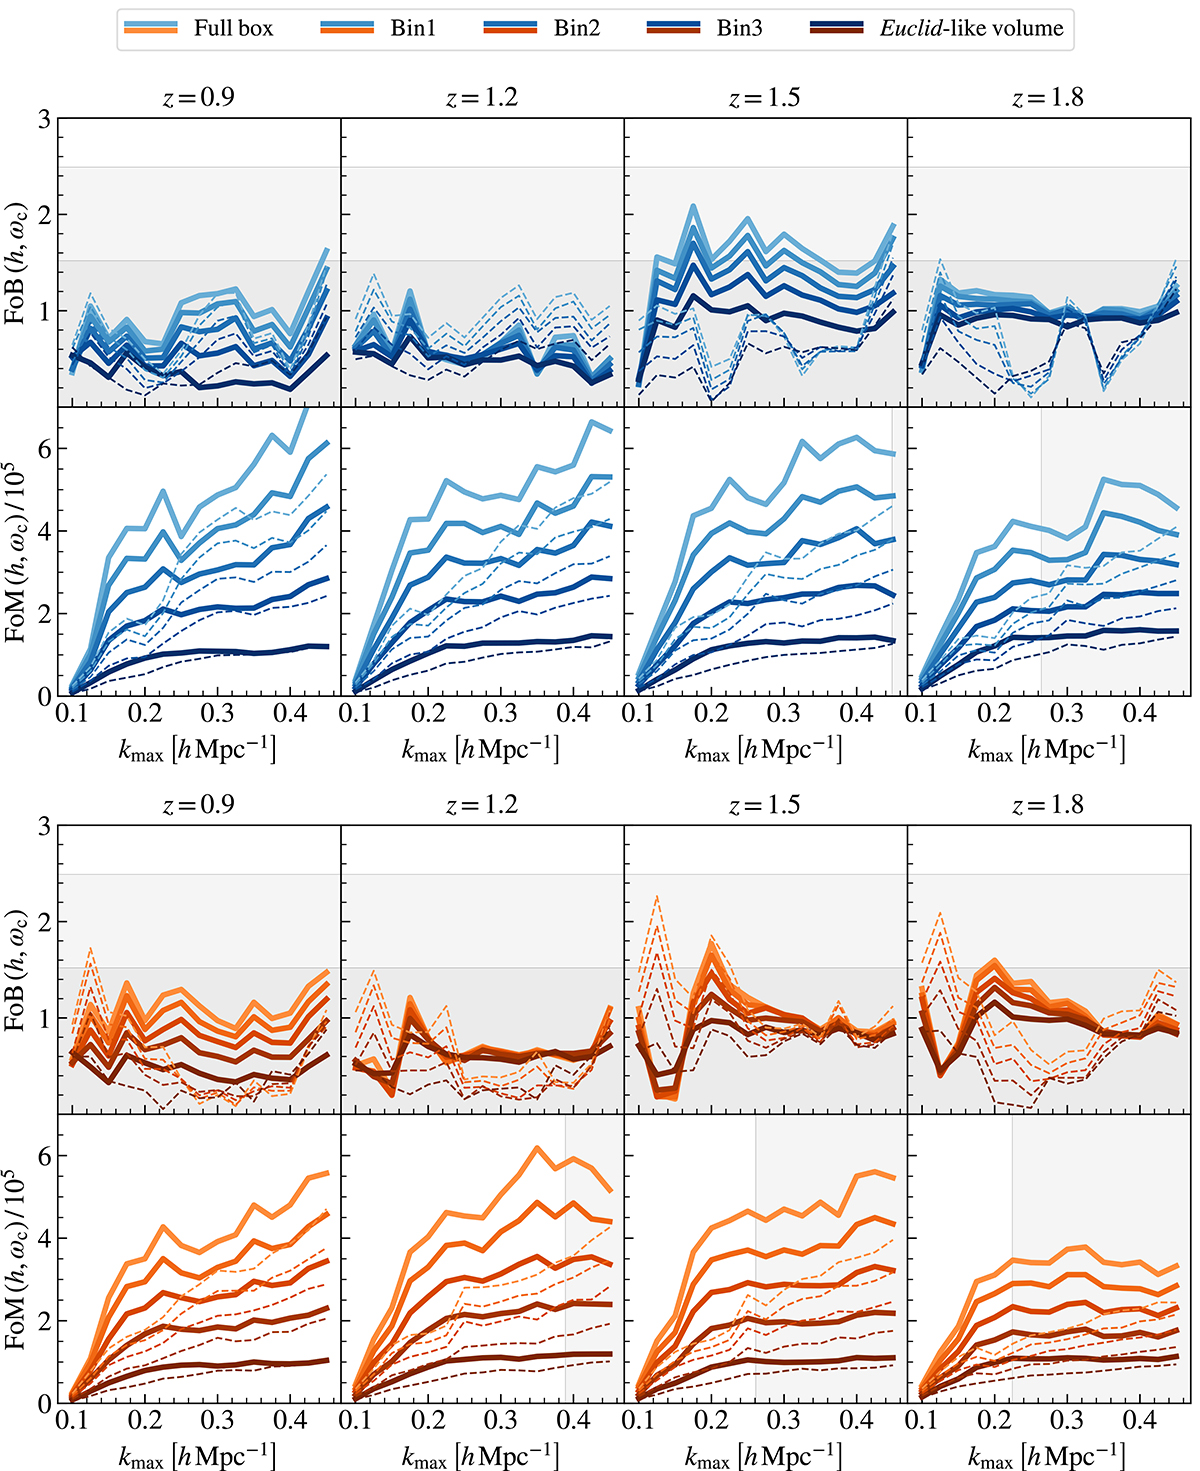
Download original image
Evolution of the FoB and FoM as a function of the different choice for the rescaling of the reference volume, as shown in the legend. Solid and dashed curves correspond to the case with bΓ3 fixed to the coevolution relation and to the case with all the parameters free to vary, respectively. All configurations of the top two rows correspond to the fits of the Model 1 HOD samples, while the bottom two rows do the same for the Model 3 HOD samples. Grey bands in the FoM panels identify the scale at which the Poisson shot-noise contribution assumes the same height of the underlying clustering signal, marking the transition to the shot-noise-dominated scales.
Current usage metrics show cumulative count of Article Views (full-text article views including HTML views, PDF and ePub downloads, according to the available data) and Abstracts Views on Vision4Press platform.
Data correspond to usage on the plateform after 2015. The current usage metrics is available 48-96 hours after online publication and is updated daily on week days.
Initial download of the metrics may take a while.