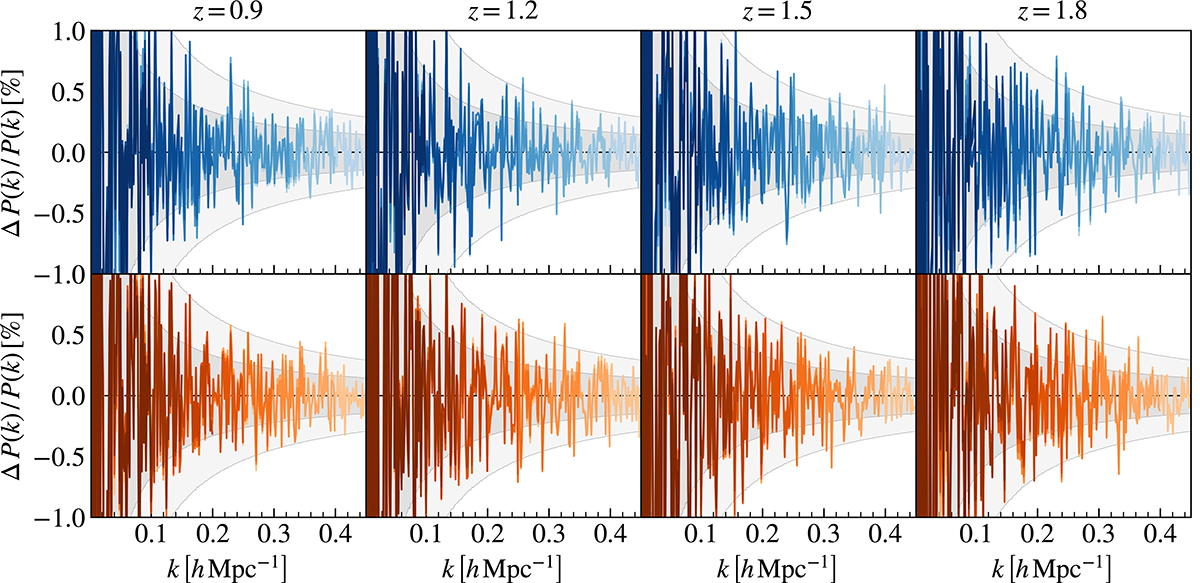
Fig. 11.
Download original image
Residuals of the maximum-likelihood best fits against the input galaxy power spectrum data vectors, assuming the case with all bias parameters free to vary. Different columns correspond to different redshifts, as shown on top of the corresponding column, while different rows mark either the Model 1 (top row) or Model 3 (bottom row) HOD sample. Different colour shades mark the best fits obtained at different kmax values, from 0.1 h Mpc−1 up to 0.45 h Mpc−1.
Current usage metrics show cumulative count of Article Views (full-text article views including HTML views, PDF and ePub downloads, according to the available data) and Abstracts Views on Vision4Press platform.
Data correspond to usage on the plateform after 2015. The current usage metrics is available 48-96 hours after online publication and is updated daily on week days.
Initial download of the metrics may take a while.